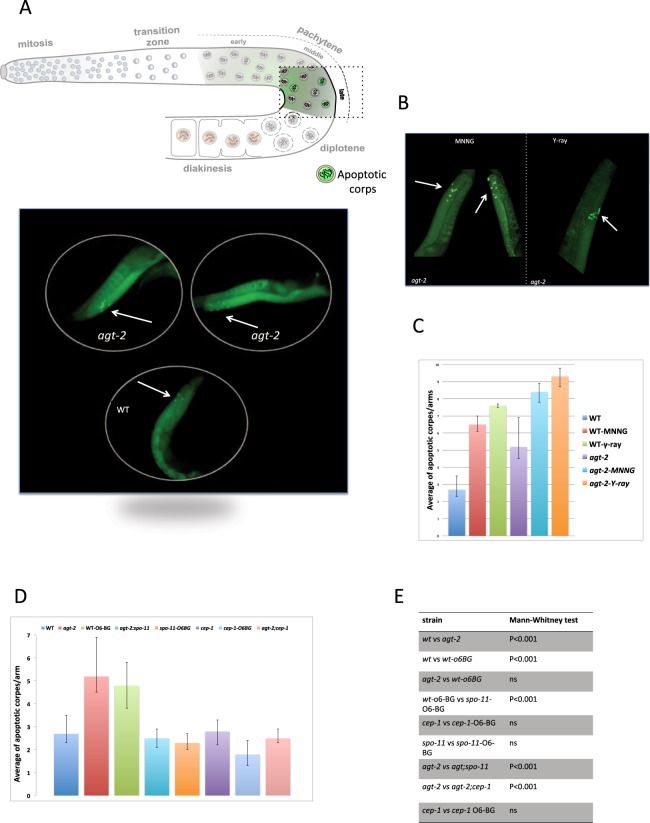
Figure 7.
Analysis of apoptosis in the indicated genotypes or treatment. (A) Upper panel: germ cell apoptosis occurs mainly within the gonad loop region nearly as developing oocytes exit the pachytene stage of meiotic prophase (late pachytene). Schematic depiction shows the position of apoptotic corps highlighted in green. Lower panel: representative images showing apoptotic corps stained with SYTO-12, in the late pachytene zone of wild type and agt-2 gonads. The arrows indicate the location of apoptotic nuclei. (B) Representative images showing apoptotic corps in the late pachytene zone of agt-2 gonads treated with the indicated damaging agent; images were taken 16 hrs and 2 hrs after MNNG (10 μM) or γ-ray, respectively. (C,D) Quantification of apoptotic corps. Histograms show the average of apoptotic corps per gonad arm in the indicated genotypes or treatment. Error bars represent the standard error of the means (S.E.M.) calculated from at least three independent experiments. (E) Statistical comparisons between data sets were conducted using a two-tailed Mann-Whitney test. A significance value of P < 0.05 was used; ns = not significant. At least 80 gonads were scored for each condition.

