Figure 2.
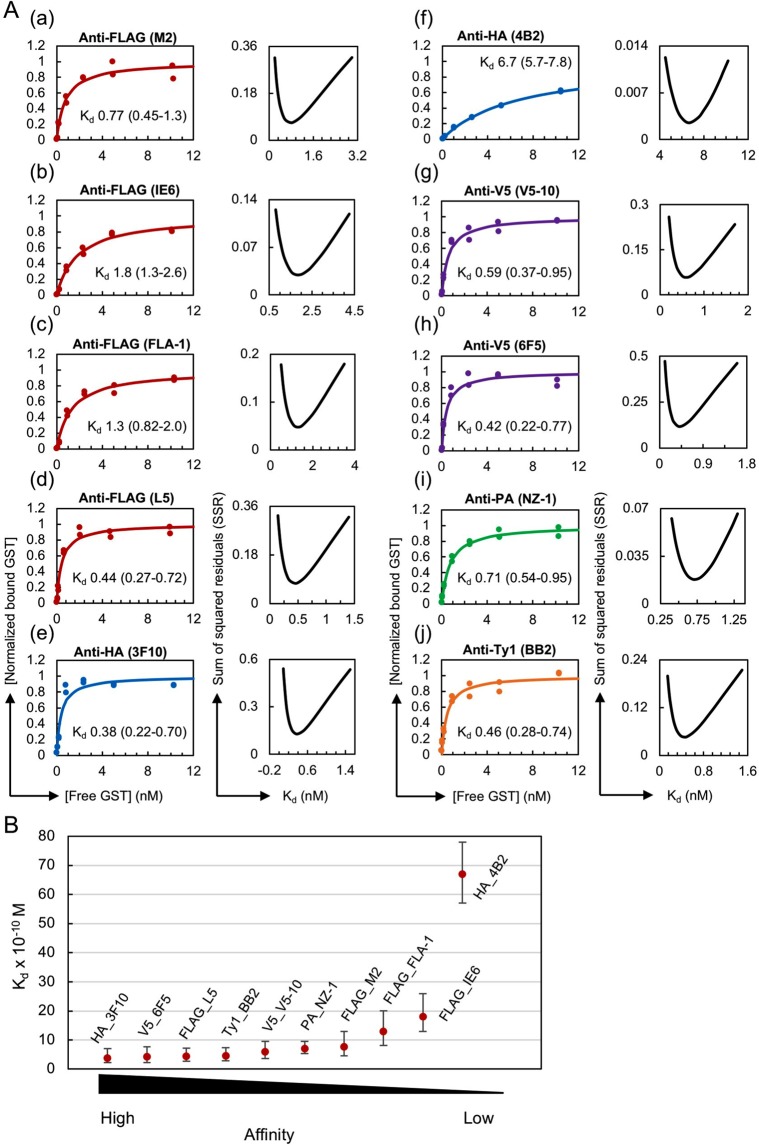
Considerable variation in Kd values among the epitope tag antibody clones. (A) (Left panel) Binding curves of the tested antibody clones against the monomeric form of the epitope tags. The antibody concentrations used for IP were as follows: 0.2 nM for anti-FLAG (M2, IE6, FLA-1 and L5) and anti-V5 (V5-10 and 6F5); 0.1 nM for anti-HA (3F10 and 4B2) and anti-PA (NZ-1); and 0.05 nM for anti-Ty1 (BB2). (Right panel) Error curves for the best-fitting Kd. In each plot, the obtained apparent Kd value in nM is shown with the 95% confidence interval. (B) Affinity comparison of the antibody clones shown in panel A. Error bars depict the plus and minus confidence interval of the Kd value.

