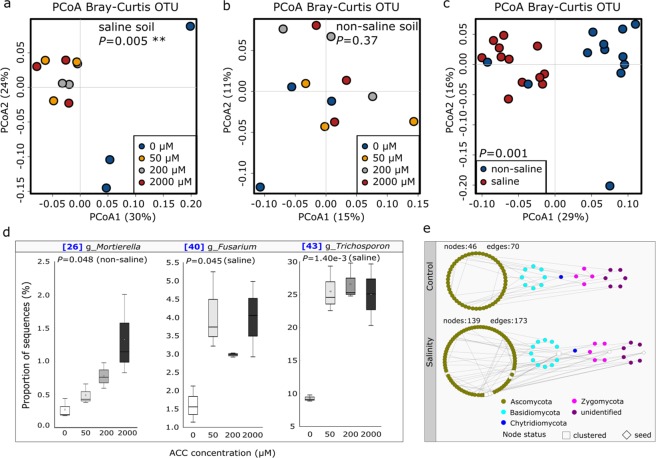
Figure 2.
Principal coordinates analysis (PCoA) summarizing variations in soil fungal communities based on ITS amplicon sequencing data (a–c); soil fungal OTUs that were mostly affected by ACC treatments under saline and non-saline conditions (d). Boxplots indicate the first and third quartiles with the median value indicated by a horizontal line and the average indicated by a star. Changes in network structure of soil fungal communities in response to salinity treatments (e).

