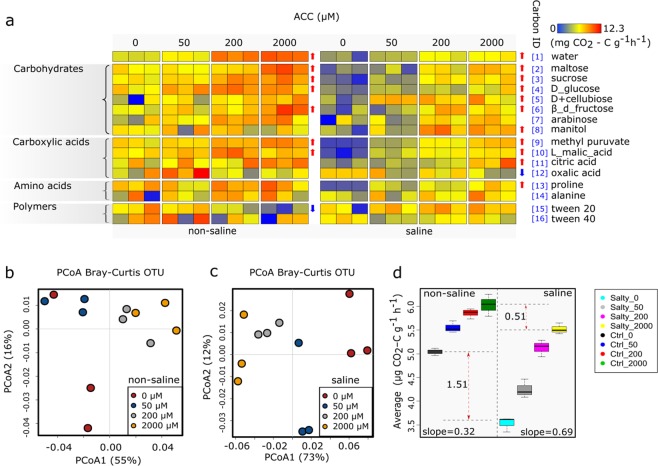
Figure 4.
Heatmap (a) and principal coordinates analysis (PCoA) (b,c) summarizing variations in the substrate utilization profiles between samples based on carbon- utilisation (CO2 evolution) data. Each carbon source has a unique numeric identifier that is consistent between figures. Average microbial utilization of 15 C substrates in the saline and non-saline soils (d). The differences in soil C substrates utilization between the saline and non-saline soils became significantly smaller (by 33.8%) when the ACC concentrations increased from 0 to 2,000 μM.

