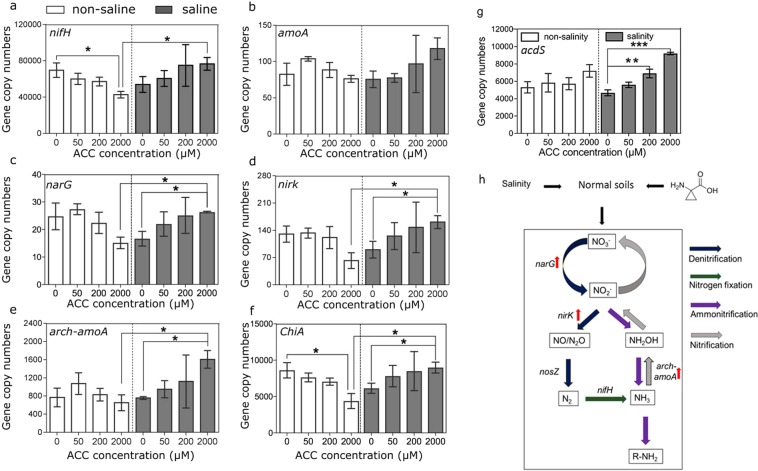
Figure 5.
Effects of ACC treatments on copy numbers of acdS gene and soil nitrogen and carbon cycling potentials. The asterisks above columns indicate significant differences between treatments (P < 0.05, ANOVA, LSD) (a–g). Error bars are SEs (n = 3). Schematic flow diagram summarizes responses of nitrogen cycling genes to ACC treatments in the saline soils (h). Upward red arrows represent significant increases of nirK, narG and arch-amoA in copy numbers by 2,000 µM ACC treatments.

