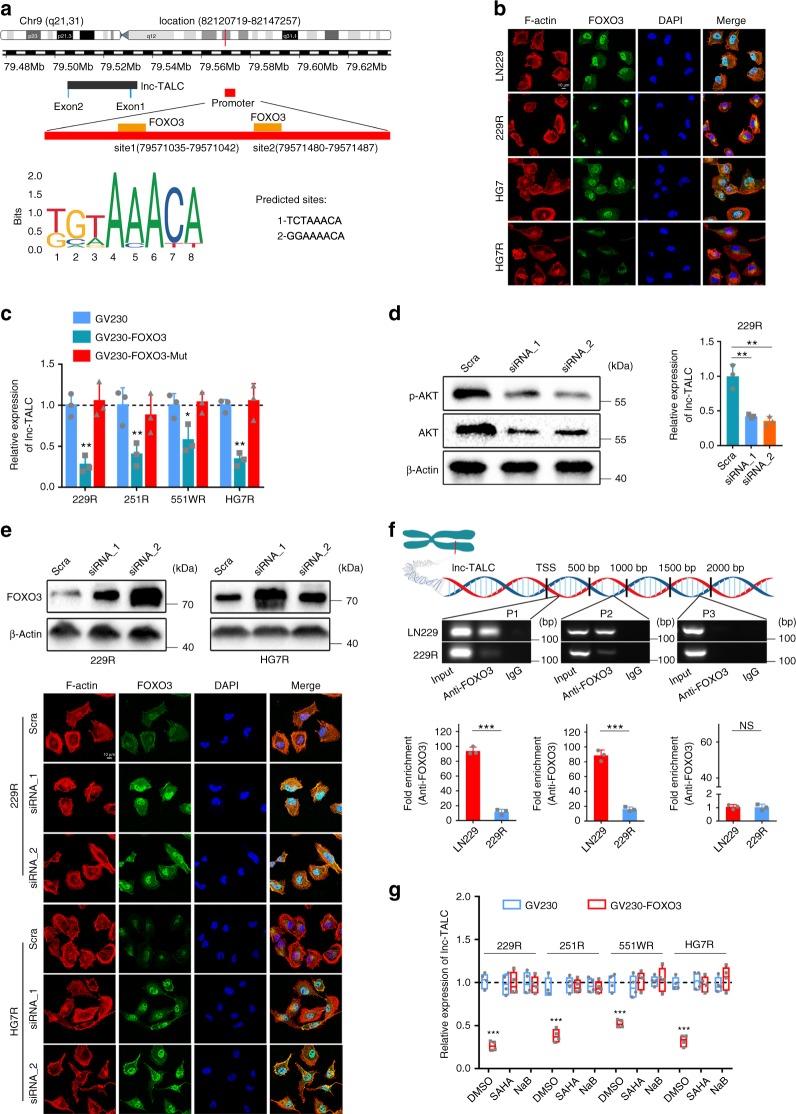
Fig. 3.
Phosphorylated AKT and the FOXO3 axis regulates lnc-TALC expression in TMZ-resistant GBM cells. a Predicted FOXO3-binding sites in the promoter region of lnc-TALC. b Immunofluorescence analysis of FOXO3 in TMZ-resistant and parental GBM cells. The nuclei were stained with DAPI. Scale bar = 10 μm. c qRT-PCR analysis of lnc-TALC levels in TMZ-resistant GBM cells transfected with FOXO3 and FOXO3-Mut plasmids after 72 h. d Left: Western blot analysis of indicated proteins in 229R cells transfected with scramble or AKT siRNA after 72 h. Right: qRT-PCR analysis of lnc-TALC in AKT siRNA and scramble TMZ-resistant GBM cells. e Upper: Western blot analysis of FOXO3 in TMZ-resistant GBM cells transfected with scramble or AKT siRNA after 72 h. Lower: Immunofluorescence analysis of FOXO3 in AKT siRNA and scramble TMZ-resistant GBM cells. The nuclei were stained with DAPI. Scale bar = 10 μm. f ChIP-PCR assay of the enrichment of FOXO3 on the lnc-TALC promoter region normalized to IgG in LN229 and 229R cells (n = 3). P3 served as a negative control without DBEs for FOXO3. g qRT-PCR analysis of lnc-TALC in TMZ-resistant GBM cells treated with SAHA and NaB after transfection with GV230-FOXO3 (n = 4). Data are presented as the mean ± S.D. P value was determined by Student’s t-test or one-way ANOVA. Significant results were presented as NS non-significant, *P < 0.05, **P < 0.01, or ***P < 0.001

