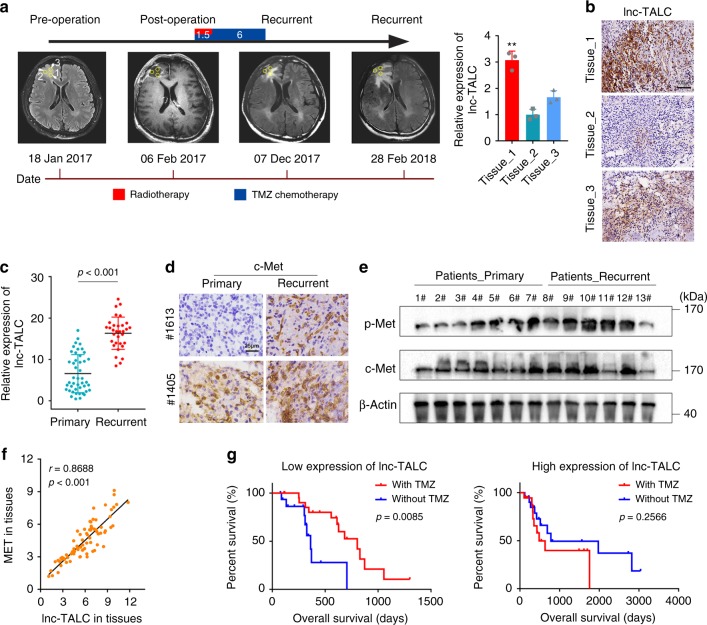
Fig. 8.
Lnc-TALC is responsible for TMZ resistance and the recurrence of GBMs in clinical patients. a Left: Representative MR images show the timeline of treatment histories (top intervals labeled in months) for patients with GBM and the schematic process of multiple sampling (labeled 1, 2, and 3). Right: qRT-PCR of lnc-TALC in multiple samples (labeled 1, 2, and 3) from the same primary GBM. b ISH of lnc-TALC in multiple samples (labeled 1, 2, and 3) from the same primary GBM. Scale bar = 100 μm. c qRT-PCR of lnc-TALC in primary and recurrent GBM tissues. The lnc-TALC expression was normalized to β-actin. d IHC of c-Met in tumor sections from primary and paired recurrent GBM samples. Scale bar = 25 μm. e Western blot analysis of c-Met and p-Met in primary and recurrent GBM sample tissues. f Pearson correlation analysis between the lnc-TALC and MET levels in 77 GBM sample tissues. g Kaplan-Meier curves of OS in GBM patients with or without TMZ chemotherapy. Left: Patients with low lnc-TALC expression. Right: Patients with high lnc-TALC expression. Data are presented as the mean ± S.D. P value was determined by Student’s t-test, one-way ANOVA, Pearson’s correlation test or Log-rank test. Significant results were presented as NS non-significant, *P < 0.05, **P < 0.01, or ***P < 0.001

