Fig. 4.
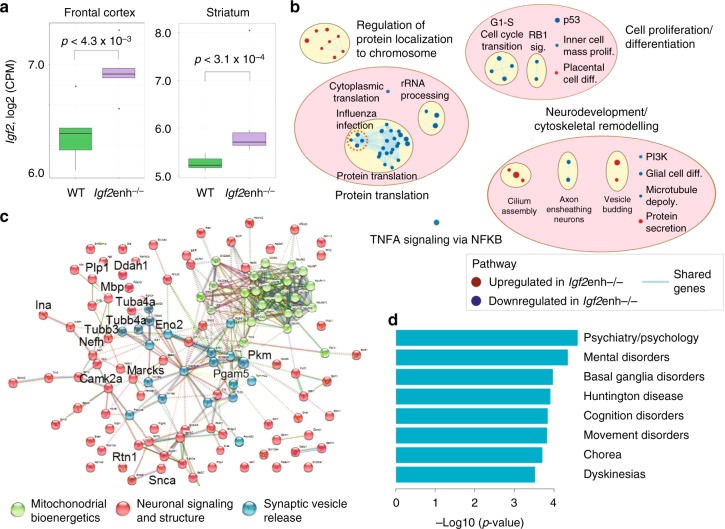
Transcriptomic and synaptic proteome alterations in the brain of mice lacking the enhancer at Igf2. a Transcript levels of Igf2 in the frontal cortex and striatum of adult wild-type and Igf2enh−/− mice. Left: frontal cortex (green boxplots: n = 6 wild-type, purple boxplots: 6 Igf2enh−/− mice). Right: striatum (n = 7 wild-type mice, 8 Igf2enh−/− mice). P-values from two-sided Wilcoxon test. Boxplot center indicates median; box bounds indicate 25th and 75th percentile, and whiskers mark 1.5 times the interquartile range. b Pathways enriched for differential expression in the striatum of Igf2enh-/- mice, relative to wild-type mice. Nodes shows pathways with q < 0.05 (68 pathways, preranked GSEA) and edges indicate shared genes (EnrichmentMap87; default setting of Jaccard and overlap = 0.375). Red nodes: upregulated expression in Igf2enh−/−; blue nodes: downregulated expression in Igf2enh−/− mice. Pathways were clustered using AutoAnnotate93. Full pathway enrichment results in Supplementary Data 15. c Functional annotation of synaptic proteins significantly altered in the striatum of Igf2enh−/− mice relative to wild-type mice (q < 0.01; one-way ANOVA; n = 6 wild-type mice, 6 Igf2enh−/− mice, 2 pools per genotype with 3 mice/pool). Genes overlapping synaptosomal proteome abnormalities in schizophrenia brain36 are highlighted. Quantitative proteome analysis by mass spectrometry and clustering of top proteins altered in Igf2enh−/− mice by STRING. Node fills indicate gene pathways; green: mitochondrial bioenergetics; red: neuronal signaling and structure; blue: synaptic vesicle release. d Disease pathways enrichment for synaptic proteins dysregulated in Igf2enh−/− mice (q < 0.05, MetaCore; 715 pathways tested; Supplementary Data 17)

