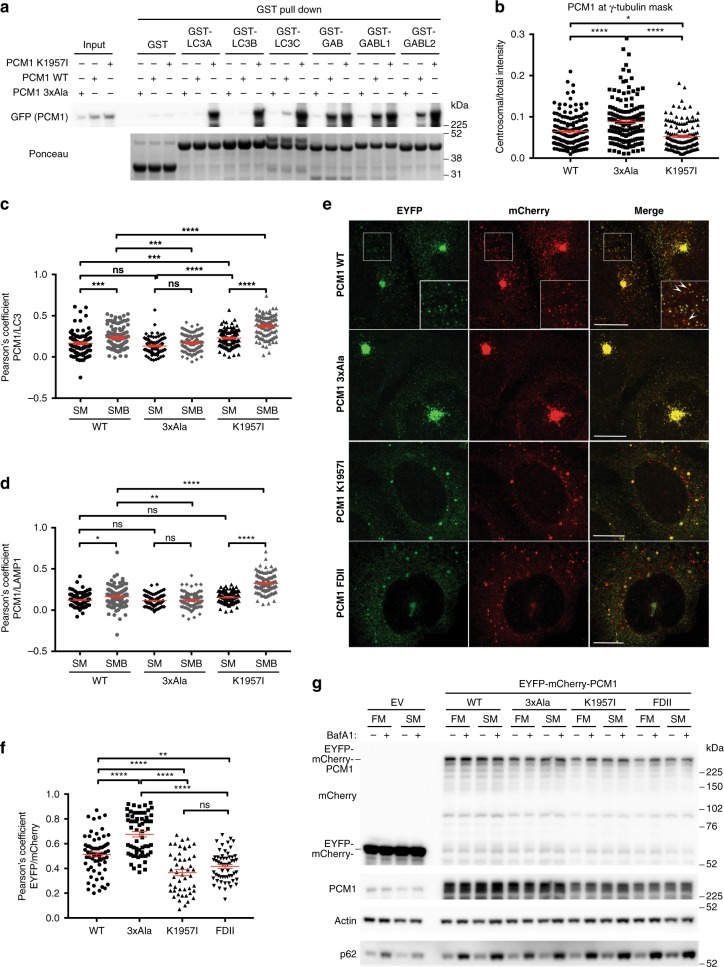
Fig. 5.
Increased LC3 binding alters pericentriolar material 1 (PCM1) dynamics in cells. a GST pulldown of HEK293A cells expressing indicated GFP-PCM1 constructs and immunoblot. b Quantification of GFP signal intensities at the centrosome (centriole and pericentriolar material marked by γ-tubulin) normalized to total GFP signal intensities of whole cells. Each measurement represents one cell; n = 4 independent experiments. c, d Quantification of GFP-PCM1 colocalization with LC3 (c) and LAMP1 (d); HEK293A cells expressing indicated GFP-PCM1 constructs starved for 2 h in Earle’s balanced salt solution (EBSS) in the absence (SM) or presence of bafilomycin A1 (BafA1) (SMB), fixed and labeled with anti-LC3 and anti-LAMP1. See also Supplementary Fig. 5c. Pearson’s coefficient was measured in 30 cells per condition per independent experiment; n = 3 independent experiments. e HEK293 cells expressing indicated EYFP-mCherry-PCM1 constructs starved for 6 h in EBSS and fixed for confocal microscopy. Scale bars represent 10 µm. f Quantification of EYFP colocalization with mCherry. HEK293 cells expressing indicated EYFP-mCherry-PCM1 constructs (shown in e) starved for 6 h in EBSS. Pearson’s coefficient was measured in at least 50 cells per condition; n = 3 independent experiments. g HEK293 cells expressing indicated EYFP-mCherry-PCM1 constructs or empty vector (EV) were incubated in full medium (FM) or EBSS (SM) for 6 h in the presence or absence of BafA1 prior to immunoblotting. Statistical analysis using one-way analysis of variance (ANOVA) test; mean ± s.e.m.; ****p ≤ 0.0001; ***p ≤ 0.001; **p ≤ 0.01; *p ≤ 0.05; ns not significant

