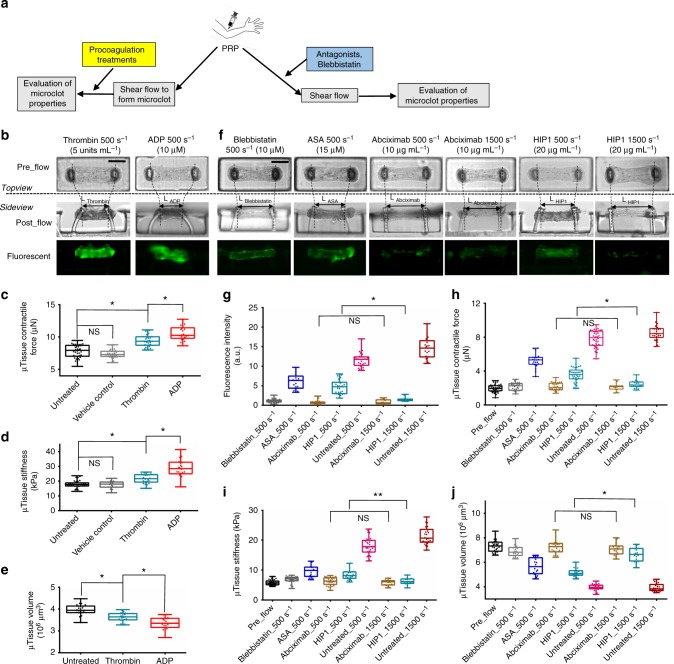
Fig. 4.
Microclot mechanics under platelet agonist and antagonist treatments. a Overview of the approaches. b Phase contrast and fluorescence images of microclots after 10 μM ADP or 5 U mL−1 thrombin treatment under flow. These microclots were first formed over 30 min of 500 s−1 platelet flow prior to agonist introduction for an additional 10 min. Measured contractile force (c), stiffness (d) and volume (e) of microclots after various procoagulation treatments. f Phase contrast and fluorescence images of microtissues formed after 30 min of 500 or 1500 s−1 platelet flow treated with blebbistatin, acetylsalicyclic acid (ASA), abciximab (anti GPIIb/IIIa) or HIP1 (anti-GpIbα) antibody. Measured fluorescence intensity (g), contractile force (h), stiffness (i) and volume (j) of microtissues formed under above anticoagulation treatments. **P < 0.05, *P < 0.005, n > 10, each dot in box plot represents an independent experiment. All box plots with whiskers represent the data distribution based on five number summary (maximum, third quartile, median, first quartile, minimum). Statistical significance was determined by one-way analysis of variance (ANOVA). Scale bar is 200 µm

