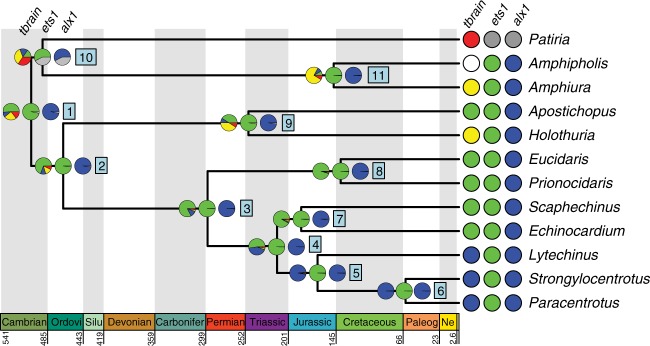
Fig. 2.
Ancestral state reconstruction of spatial gene expression data using a single-rate Markov model42 across eleutherozoan echinoderms. Ancestral states of alx1, ets1, and tbrain, three transcription factors critical to euechinoid larval skeletogenic cell specification. Geological timescale shown at bottom. Nodes are represented by boxed numbers. For each extant character state, the probability that it occurs at the ancestral node was estimated. The pie charts at each node show the mean posterior probability for each spatial expression pattern of the genes shown at right. The colors represent the character states shown in Fig. 1c. Abbreviations in the geological timescale are as follows: Ordovi Ordovician, Silur Silurian, Carbonifer Carboniferous, Paleog Paleogene, Ne Neogene

