Fig. 4.

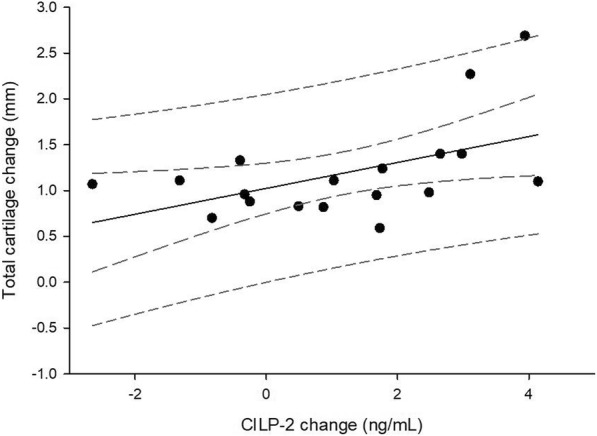
Linear regression analysis plot of total cartilage change as a function of change in CILP-2. Dashed lines are ±95% confidence and 95% prediction lines

Linear regression analysis plot of total cartilage change as a function of change in CILP-2. Dashed lines are ±95% confidence and 95% prediction lines