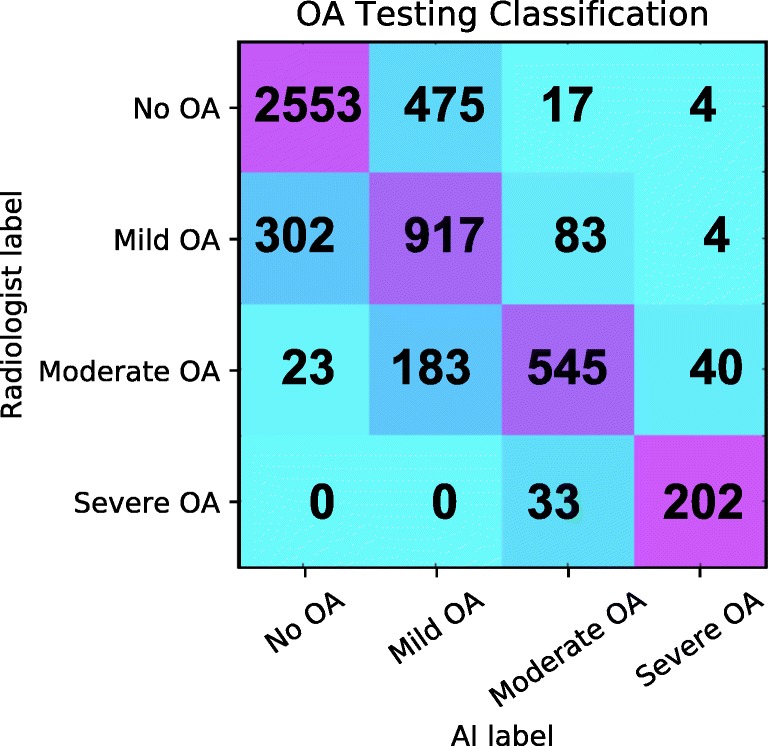
Fig. 2.

Confusion matrix for OA: true labels are the rows while the predicted labels are the columns. The diagonal represents the number of correct predictions for that class. The total number of subjects in each group can be obtained by summing that respective row. Darker squares represent a higher percentage of that group classified for a predicted label
