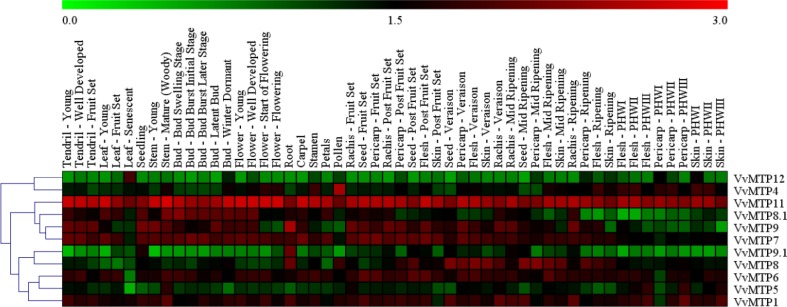
Fig. 7.
MTP genes in grape and their expression in 54 specimens of green and woody tissues, and organs at various growth phases. The genes that have the same profiles for all arrays are grouped on the left using a hierarchical clustering method. The intensity of expression is defined in the colored bar at top of the chart. The scale bar represents log10 values from 0 to 3. The color bar outlines proportional expression values, the lowest (green), medium (black) and the highest (red)

