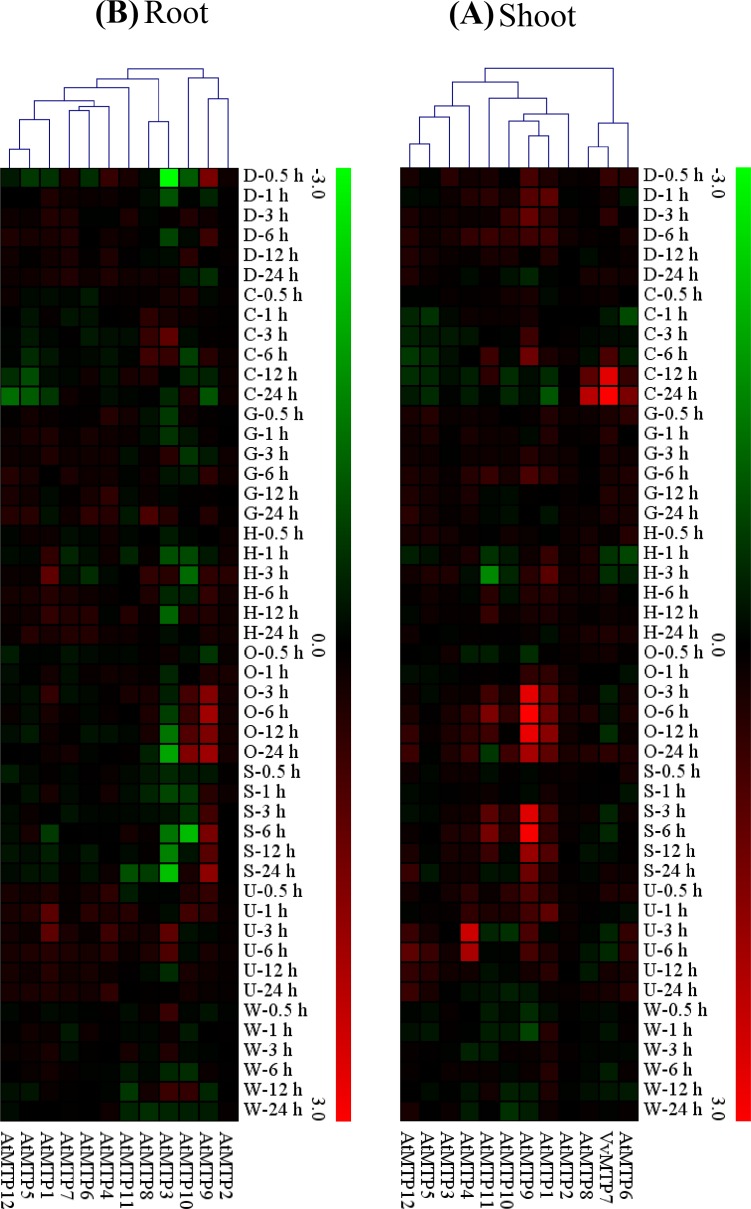
Fig. 8.
Expression patterns of putative MTP homologous genes in the shoots (a) and (b) roots of Arabidopsis plants under salinity, drought, osmotic, high and low temperatures, genotoxic, and UV and physical treatments, after hours of stress (0.5, 1, 3, 6, 12 and 24 h). Fold differences are shown as log2 value. Genes that have the same profiles throughout arrays are grouped on the top using a hierarchical clustering method. The color bar right indicates the levels of relative expression, the lowest (green), medium (black) and the highest (red)

