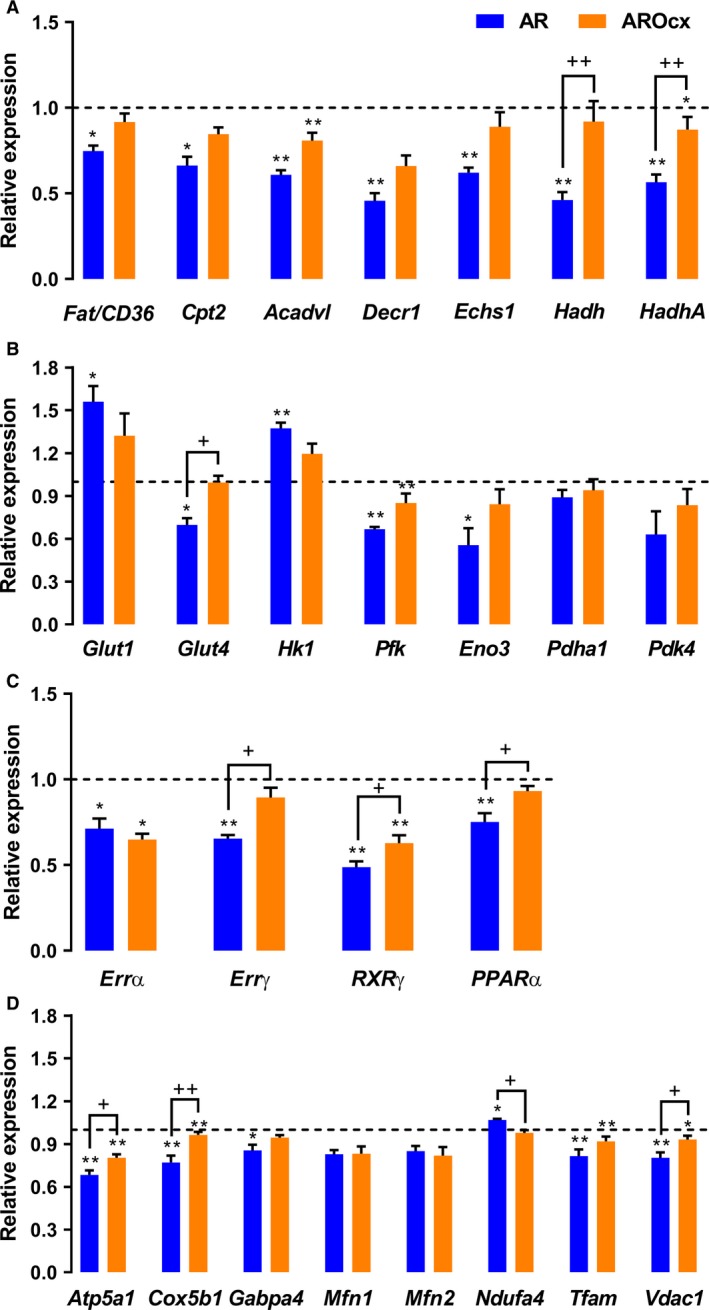
Figure 4.

Evaluation by real‐time quantitative RT‐PCR of the LV mRNA levels of genes encoding for proteins related to fatty acid uptake and oxidation (A), for proteins relevant to glucose metabolism (B) for transcription factors related to fatty acid metabolism (C) and mitochondrial function and biogenesis (D). The results are reported in arbitrary units (AU) as the mean ± SEM (n = 5–6/gr.). Messenger RNA levels of the S group were normalized to 1 and are represented by the dotted line. *P < 0.05 or **P < 0.01 versus their respective sham group and + P < 0.05 or ++ P < 0.01 between the indicated groups.
