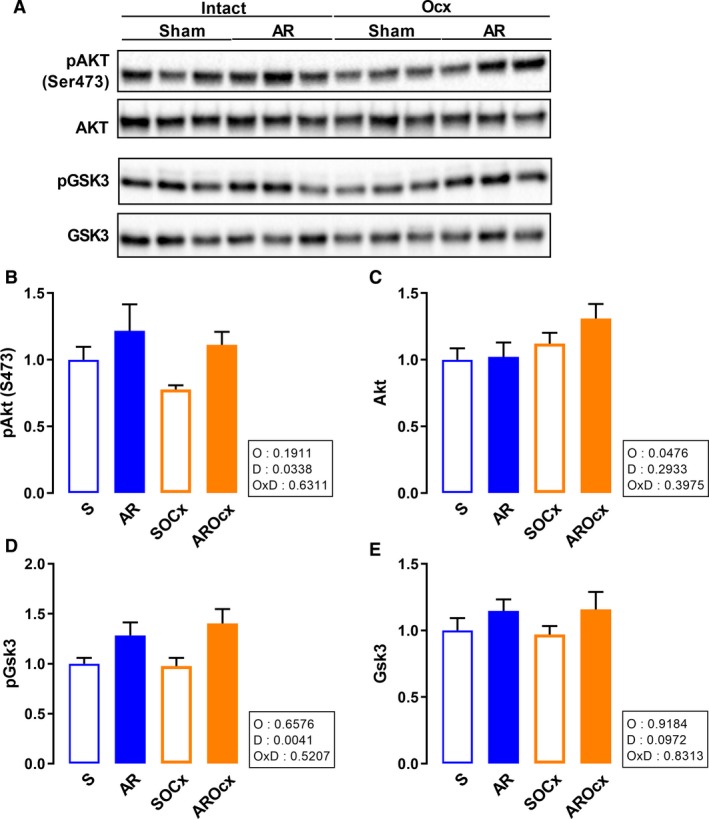
Figure 7.

LV protein content of Akt and Gsk3. Representative blots for each signaling molecules (A). Graphs B to E represent densitometric measurement after normalization. Phosphorylated Akt on serine 473 (B), total Akt (C), phosphorylated Gsk3 (D), total Gsk3 (E). The results are reported in arbitrary units (AU) as the mean ± SEM (n = 6/gr.). Probability values in the boxes are from a two‐way ANOVA and symbols, from Holm‐Sidak multiple comparisons post‐test. *P < 0.05 versus their respective sham group and + P < 0.05 between the indicated groups.
