
Fig. 8.
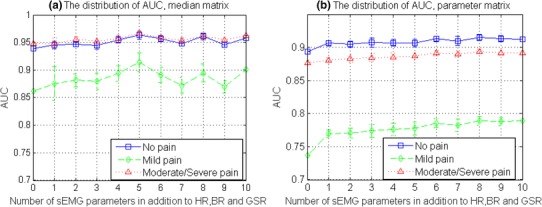
The distribution of AUC (mean ± SD) from classification with different number of sEMG parameters in addition to HR, BR and GSR, with all possible combinations. Results from the classification of median matrix are shown in Fig. 8a and results from the classification of parameter matrix are shown in Fig. 8b