Fig. 5.
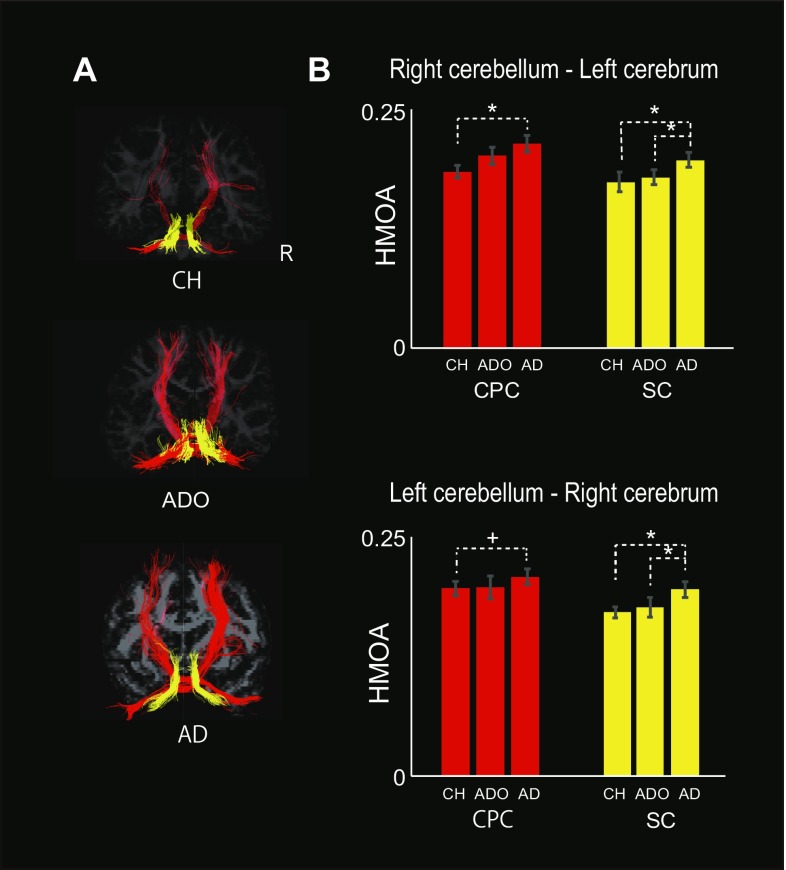
The tractography of each tract in a representative participant (a) and the mean hindrance-modulated orientational anisotropy (HMOA) value across participants in each group for the cortico-ponto-cerebellar (CPC) and superior cerebellar (SC) tracts (b). a The tractography of each tract (right-cerebellum–left-cerebrum and left-cerebellum–right-cerebrum of the CPC or SC tracts) in a representative participant from each group (CH, ADO, and AD from the top to bottom panels). The hemisphere on the right is the right hemisphere. Red tracts indicate the CPC tracts and yellow tracts indicate the SC tracts that connect the right-cerebellum and left-cerebrum and the left-cerebellum and right-cerebrum. b The mean HMOA value across participants in each group (vertical axis) is indicated for each tract (red bars for CPC and yellow bars for SC). The upper panel presents the data obtained from the tractography that connects the right cerebellum and the left cerebral cortex (cerebrum), and the lower panel presents the data obtained from the tractography that connects the left cerebellum and the right cerebrum. A small line mounted on each bar indicates the standard error of the mean across the participants in each group. A significant group difference is indicated by an asterisk above the graph (family-wise error-corrected for multiple comparisons, *p < 0.05, +p < 0.1). AD adult, ADO adolescent, CH child

