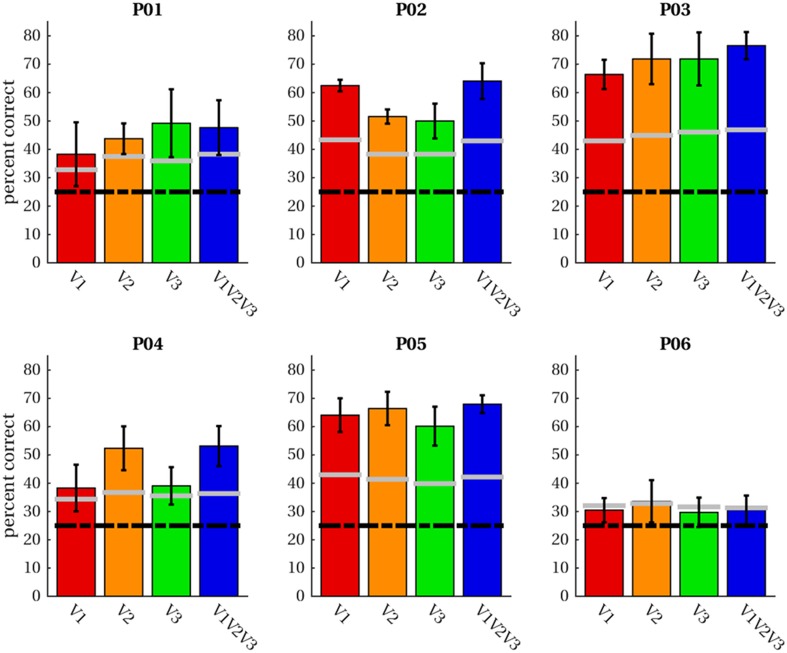
Fig. 10.
Classification accuracies. Average classification accuracies across four leave-one-out runs of imagery data are given for four ROIs in each participant. Classification was performed for letter-specific voxel patterns averaged in the range from + 2 until + 3 volumes after trial onset. The black dashed line indicates accuracies expected by chance; grey lines demarcate the 95th percentile of permutation classification accuracies

