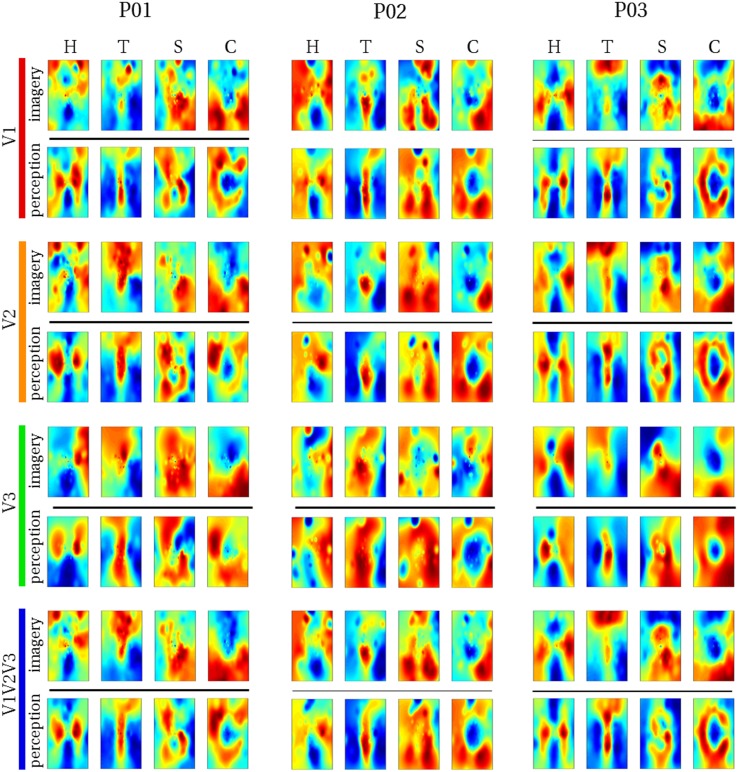
Fig. 4.
Reconstructed visual field images (participants 1–3). Reconstructed average visual field images are visualized for each ROI of participants one, two, and three. Reconstructions of the remaining three subjects are shown in Fig. 5. Perceptual as well as imagery voxel patterns were obtained from raw BOLD time-series

