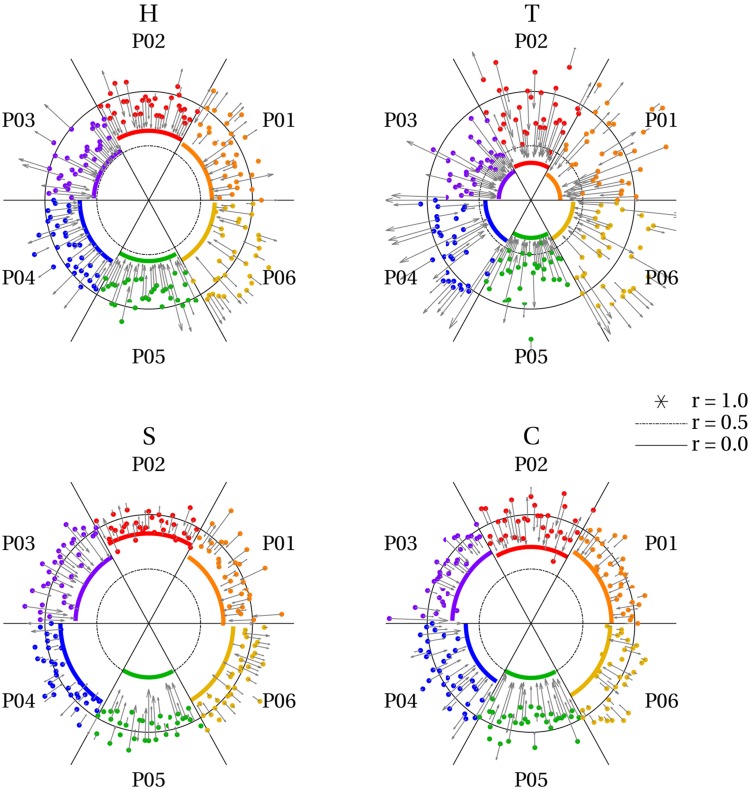
Fig. 6.
Effect of autoencoder on trial-specific reconstruction quality. The radius of the circles represents reconstruction quality (correlations) with r = 1 at the center, r = 0.5 at the inner ring (dash–dot), and r = 0 at the outer ring (solid). Each angle represents an imagery trial with 32 trials per letter and participant. Participants are color coded. Solid-colored lines reflect reconstruction quality based on average perceptual voxel patterns of one participant. This constitutes a baseline against which to compare imagery reconstruction quality. Colored dots reflect imagery reconstruction quality for each individual trial of a participant. Finally, arrows reflect the displacement of each of these dots after feeding imagery data through the autoencoder. That is, the tip of the head reflects the new position of the dot after applying the autoencoder. Most points were projected onto the perception-level correlation value and hence approached the center. However, some moved further away from the center

