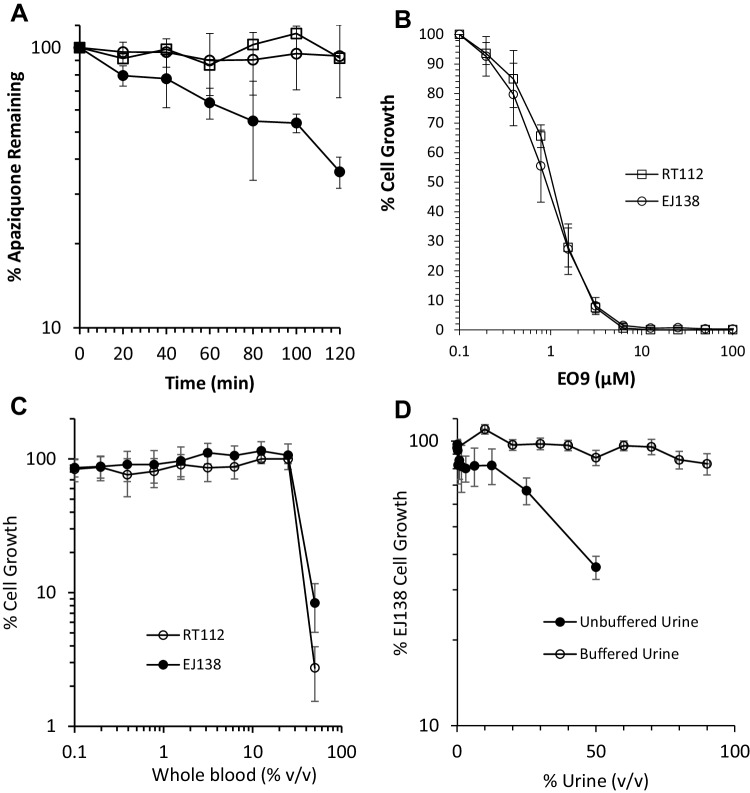
Fig. 1.
Metabolism of apaziquone by human blood and establishment of the haematuria model. a Time-dependent metabolism of apaziquone following incubation at 37 °C in whole blood (filled circle), plasma (unfilled circle) and PBS (unfilled square). Each value represents the mean ± standard deviation for three independent experiments. The response of EJ138 and RT112 cells following a 1-h exposure to EO9 is presented in b. Values represent the mean ± standard deviation for three independent experiments. The response of cells to whole blood and urine are presented in c and d, respectively. Exposure times were 1 h and each result represents the mean ± standard deviation for eight replicates

