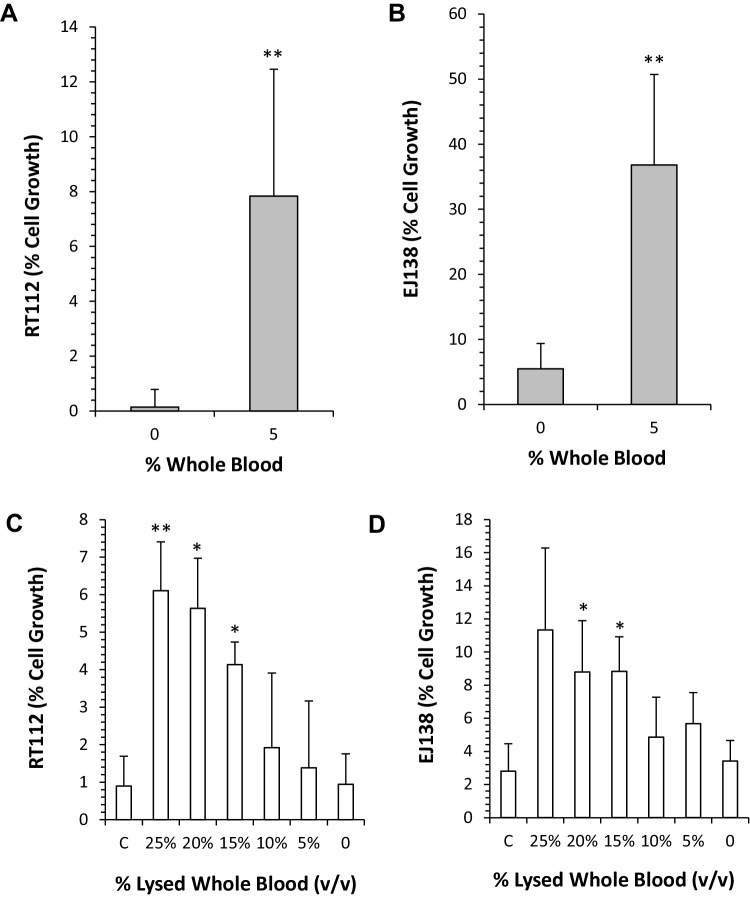
Fig. 2.
Response of RT112 and EJ138 cells to EO9 in the presence and absence of whole blood and lysed whole blood. a, b Response of RT112 and EJ138, respectively, to a 1-h exposure to apaziquone (5 µM) in buffered urine (75% v/v) without (0) or with whole blood (5% v/v). Following drug exposure, cell growth was determined 96 h later using the MTT assay. c, d RT112 and EJ138 treated with apaziquone (5 µM), urine (75%) and various concentrations of lysed whole blood. Exposure to experimental conditions was for 1 h, followed by a 96 h recovery period prior to the assessment of cell growth using the MTT assay. Control experiments (c) used media plus apaziquone only (no urine or lysed whole blood). Statistical analysis was performed using a paired t test comparing the effects of each treatment with that of controls (** and * denote statistical significance at p < 0.01 and p < 0.05, respectively)

