
Figure 1.
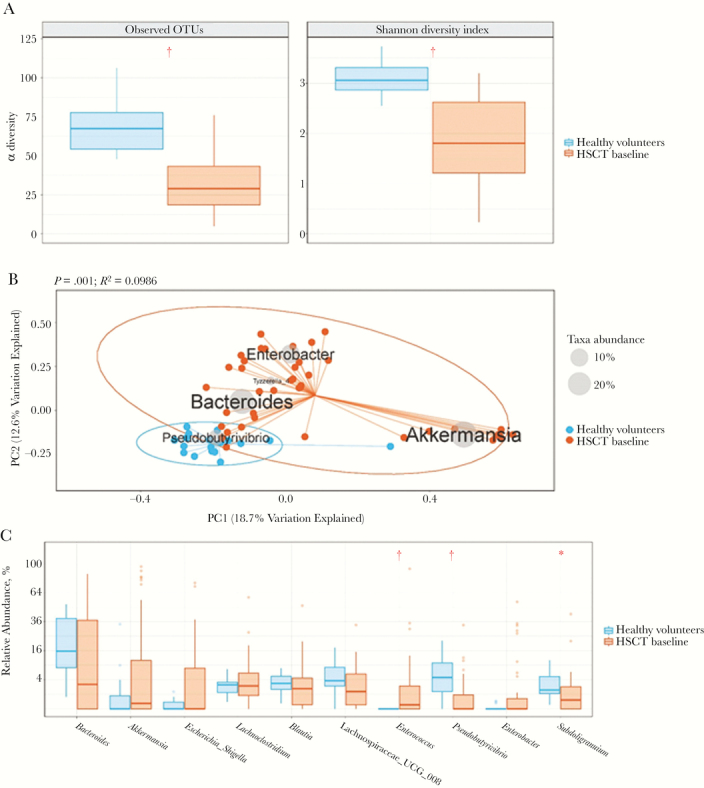
Differences in microbial diversity between healthy volunteers and hematopoietic stem cell transplant (HSCT) recipients at baseline. A, Box plots of the number of observed operational taxonomic units (OTUs) and the Shannon diversity index for each group are shown, where blue represents 1-time samples from healthy volunteers and orange, samples from HSCT recipients at baseline. †P < .001 (nonparametric Mann-Whitney U test). B, Principal coordinate analyses using Bray-Curtis distances. Biplot displays the dominant taxa (listed on the diagram where average genera abundance across samples is denoted by size of the gray sphere in inlaid legend), which explain the variation seen in the principal component analysis plot. Again, blue represents 1-time samples from healthy volunteers, and orange, samples from HSCT recipients at baseline. Permutational multivariate analysis of variance test was used to determine P and R2 values for the differences between the 2 groups. C, Box plots of the differences in relative abundance of the top 10 most abundant genera, with a minimum average abundance of >0.01. P values were determined using the nonparametric Mann-Whitney U test and were adjusted to account for multiple testing using the Benjamini-Hochberg correction. *P < .01; †P < .001.