FIGURE 2.
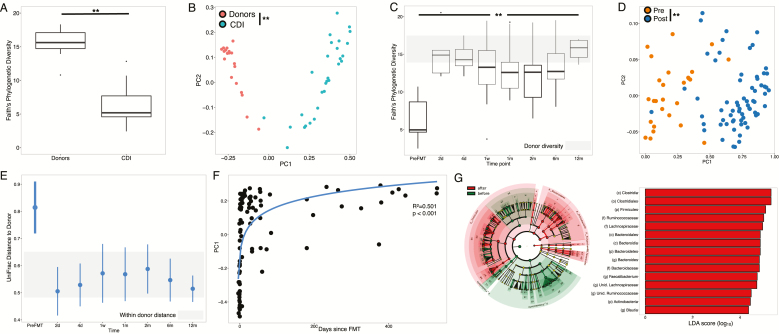
A, Alpha diversity of samples from donors (n = 19) and CDI patients (n = 29) pre-FMT (P < 0.05, Student t test). B, PCoA plot based on beta diversity distances of donors and CDI patients pre-FMT (p-0.02, PERMANOVA). C, Boxplots indicating alpha diversity at each time point in all patient samples. Gray shaded area indicates the range of alpha diversity in donor samples. All time points had significantly higher diversity than pre-FMT, ANOVA with post hoc Tukey honestly significant difference (HSD) (P < 0.05). D, PCoA plot based on beta diversity distances before and after FMT (P < 0.05, PERMANOVA). E, Engraftment (measured by UniFrac) distance from recipient to own donor in patients over time. Gray shaded area indicates distance within donors. At each time point, ranges indicate mean +/- standard deviation of paired distances to donors. F, First principal coordinate from the PCoA plot vs time since transplant. Curve represents log10 fit (R2 = 0.501; P < 0.05). G, LEfSe analysis comparing microbial composition before (green) and after (red) FMT. Represented are all taxa significantly distinct (P < 0.05) with LDA scores >2.0.

