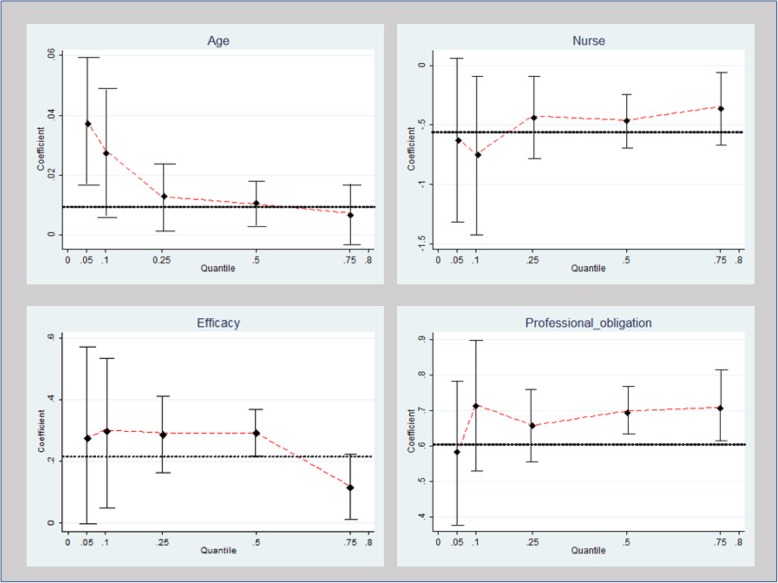
Fig. 1.
Quantile plots for ‘Willingness to respond’ displaying the statistically significant parameters in the multivariate regression analysis. The x-axis represents the location in the distribution (i.e. quantile) of the willingness measure; the y-axis represents the size of the unstandardized coefficient values at each point of the outcome distribution (controlling for all other variables). The black diamond-shaped markers represent the coefficient values across different quantiles; the red dashed line represents an estimation of coefficient values across a range of quantile distribution (Q5 to Q75); vertical lines (error bars) indicate 95% confidence interval; the horizontal black dashed line represents the unstandardized coefficient value in the linear regression (for each parameter)

