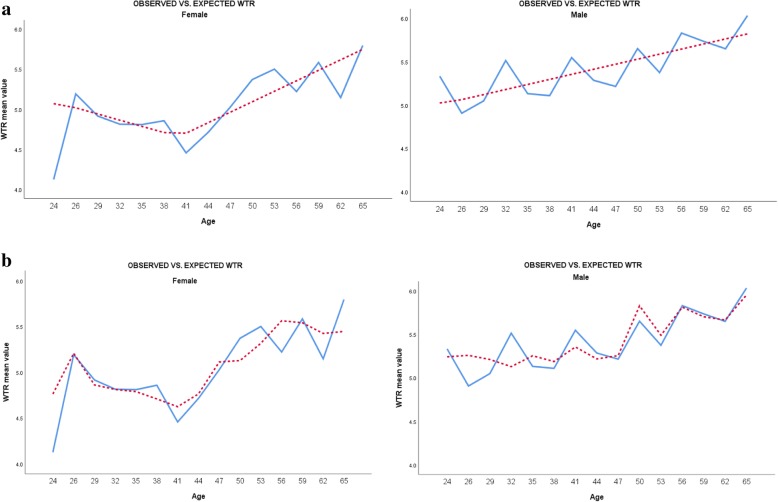
Fig. 2.
The relationship between participants’ age and mean value of willingness measure (WTR), according to gender (right column for males and left column for females); (a + b) describe the results of two multivariate spline regression models, the dependent variable being ‘willingness to respond’: (a) independent variables included in the model are age and spline age-based knots (X25, X30, X35, X40, X45, X50, X55, X60, X64); (b) independent variables included in the model are spline knots and age, profession, efficacy, and professional obligation. *The blue lines represent the observed values of WTR. Red dashed lines represent expected WTR.

