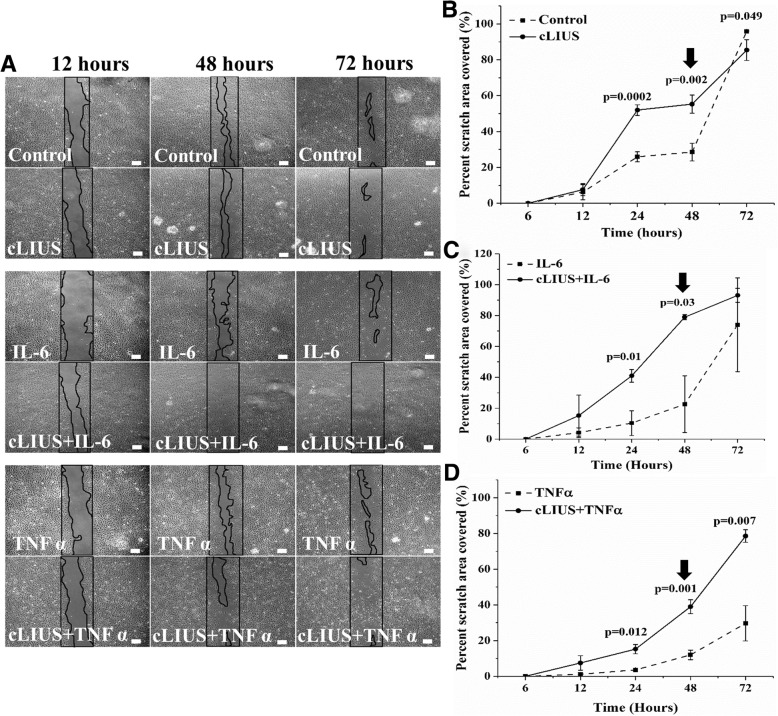
Fig. 8.
Migration of chondrocytes under cLIUS and cytokines as measured in scratch assays. a The figure depicts phase contrast micrographs of the scratch area of chondrocytes at 12, 48 and 72 h (n = 3 scratch areas in 3 separate wells, 5× magnification; scale bar = 100 μm) in the presence or absence of IL-6 or TNFα under cLIUS at 14 kPa (5 MHz, 2.5 Vpp) for 20 min. Non-cLIUS-stimulated chondrocytes served as control (n = 3 scratch areas in 3 separate wells). Percentage scratch area closed by migrating chondrocytes at 6, 12, 24, 48 and 72 h normalized to the wound area at 0 h under no cytokine (b), IL-6 (c) and TNFα (d) were quantified by ImageJ software. Data represented as mean ± 95% confidence interval

