Fig. 5.
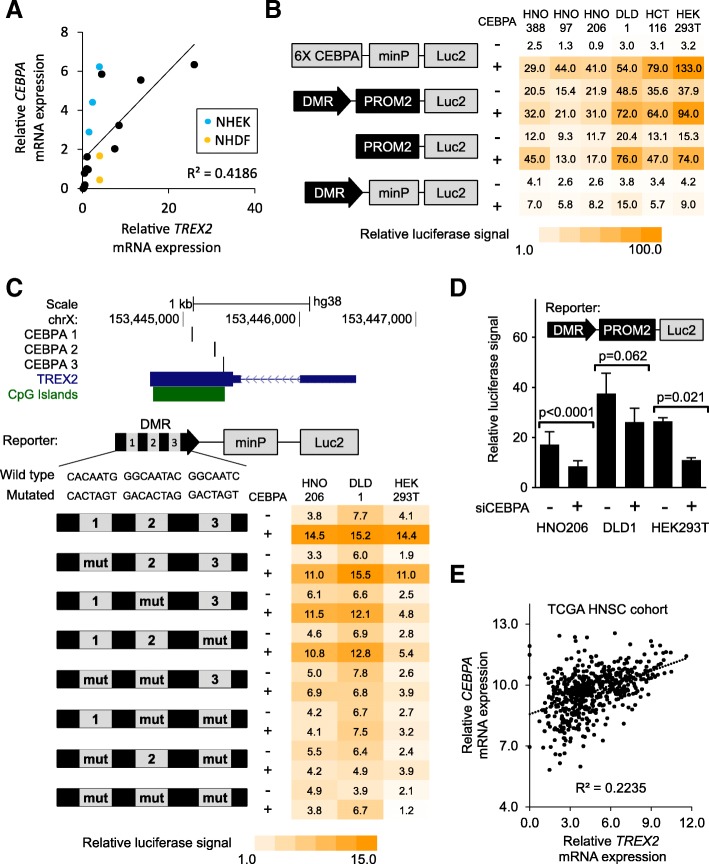
TREX2 induction by the transcription factor CEBPA. a Correlation of average TREX2 and CEBPA mRNA expression determined by qRT-PCR (duplicates) in cell lines and primary cells (n = 18); primary cells (NHEK, blue; NHDF, yellow) are marked. b Heat map depicting relative luciferase signal in different cell lines (HEK293T, colorectal cancer cells HCT116 and DLD1, HNSCC cells HNO388/97/206) transfected with TREX2 luciferase reporter constructs depending on CEBPA levels. Schematic view of reporters is shown to the left. Luciferase signals depict mean of duplicates normalized to empty vector (pGl4.23) control. Co-transfection of CEBPA overexpression plasmid (CEBPA) is indicated. 6X CEBPA, synthetic CEBPA pathway reporter element with 6 tandem CEBPA consensus binding sites. c Upper panel: map of the TREX2 gene locus with predicted CEBPA binding sites, TREX2 transcript, and CpG islands are indicated. Lower panel: heat map depicting relative luciferase signal in different cell lines transfected with TREX2 luciferase reporter constructs. Schematic view of reporters is shown to the left, with site-directed mutagenesis of predicted CEBPA binding sites (mut) indicated. Luciferase signals depict mean of duplicates normalized to empty vector (pGl4.23) control. Co-transfection of CEBPA overexpression plasmid (CEBPA) is indicated. d Luciferase reporter assay in different cell lines under co-treatment with siRNAs directed against CEBPA (siCEBPA). Schematic view of the transfected reporter construct (TREX2 promoter and DMR) is included. Bars depict mean and standard deviation from quadruplicate experiments. e Correlation of TREX2 and CEBPA mRNA expression determined by RNA sequencing in the TCGA head and neck squamous cell carcinoma (HNSC) cohort (n = 566), as log2(x + 1) transformed RSEM-normalized count. p values refer to unpaired Student’s t test. For correlations, Pearson coefficient (R) is shown. minP/Luc2, minimal promoter/luc2 luciferase gene included in the pGl4.23 vector

