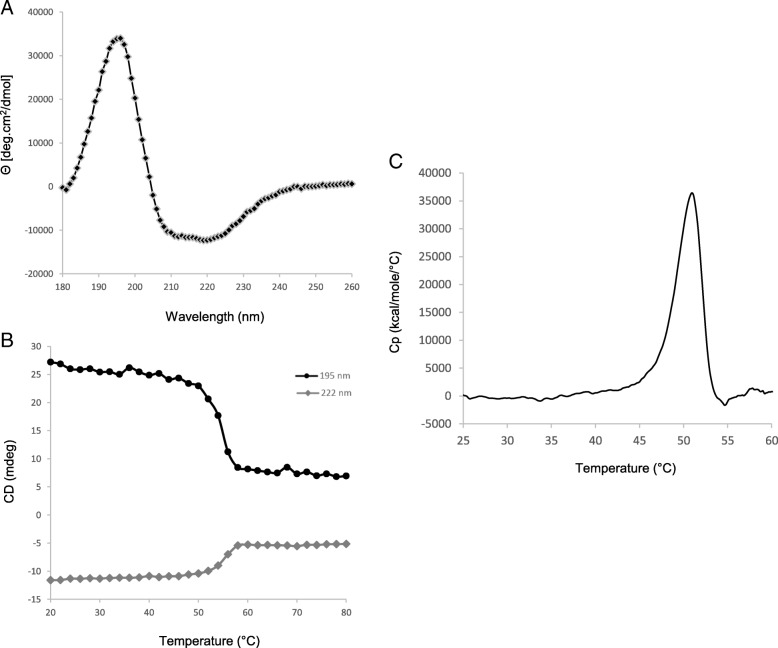
Fig. 3.
Secondary structure analysis of RelSt3 folding and stability. a Far-UV spectrum of RelSt3 protein (12 μM) at 20 °C was recorded as the average of 3 scans from 180 to 260 nm, and converted to mean residue ellipticity. b Thermal denaturation curve of RelSt3 protein followed from 20 to 80 °C (1 °C/min) at 195 (black curve) and 222 nm (grey curve). c Differential scanning calorimetry analysis was performed with RelSt3

