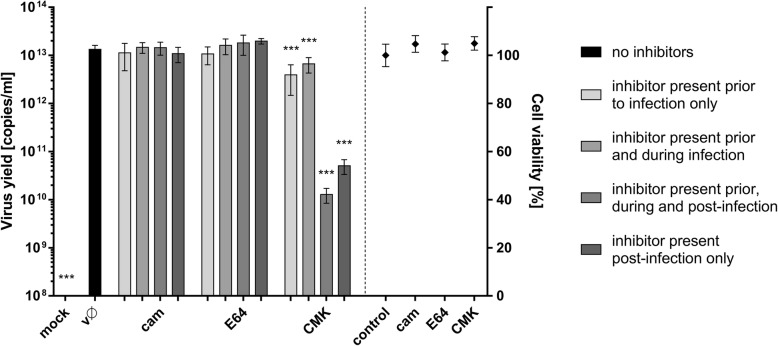
Fig. 5.
Cellular proteases and ZIKV. Vero cells were treated with proteases inhibitors (as outlined in the figure) and virus yield 3 days p.i. was assessed using RT-qPCR (left side of the graph); cytotoxity of inhibitors is presented on the right side of the graph (XTT assay). mock – mock infected cells; vØ – ZIKV- infected cells; cam – 100 μM serine protease inhibitor camostat; E64–100 μM cysteine protease inhibitor E64; CMK – 50 μM furin inhibitor CMK; control – inhibitor-untreated, non-infected cells. The data is presented as mean ± SD. To determine the significance of differences between compared groups, single-factor analysis of variance (ANOVA) was applied. P values < 0.05 were considered significant. One asterisk (*) identifies adjusted P values between 0.01 and 0.05, two asterisks (**) identify adjusted P values between 0.01 and 0.001, three asterisks (***) identify adjusted P values between 0.001 and 0.0001

