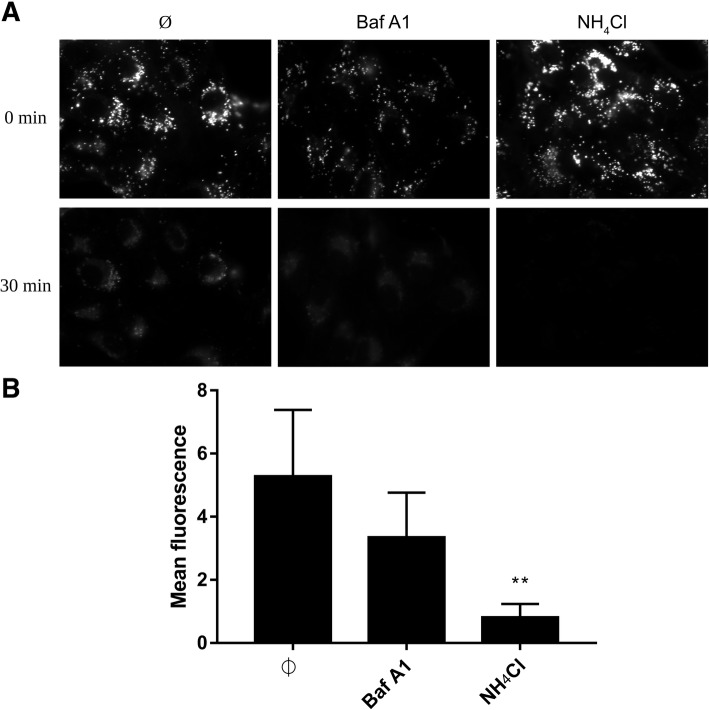
Fig. 6.
Endosome acidification in living cells treated with Baf A1 and NH4Cl. Vero cells were incubated with LysoTracker™ Red DND-99 for 90 min at 37 °C and overlaid with BafA1, NH4Cl or control medium (Ø) and signal was recorded for 30 min with a fluorescence microscope. (a) Images acquired at the beginning (0 min) and by the end (30 min) of incubation. (b) Mean fluorescence of the LysoTracker™ Red DND-99 based on the set of xy images collected every 10 s in a 30 min period. The data is presented as mean ± SD. To determine the significance of differences between compared groups, single-factor analysis of variance (ANOVA) was applied. P values < 0.05 were considered significant. One asterisk (*) identifies adjusted P values between 0.01 and 0.05, two asterisks (**) identify adjusted P values between 0.01 and 0.001, three asterisks (***) identify adjusted P values between 0.001 and 0.0001

