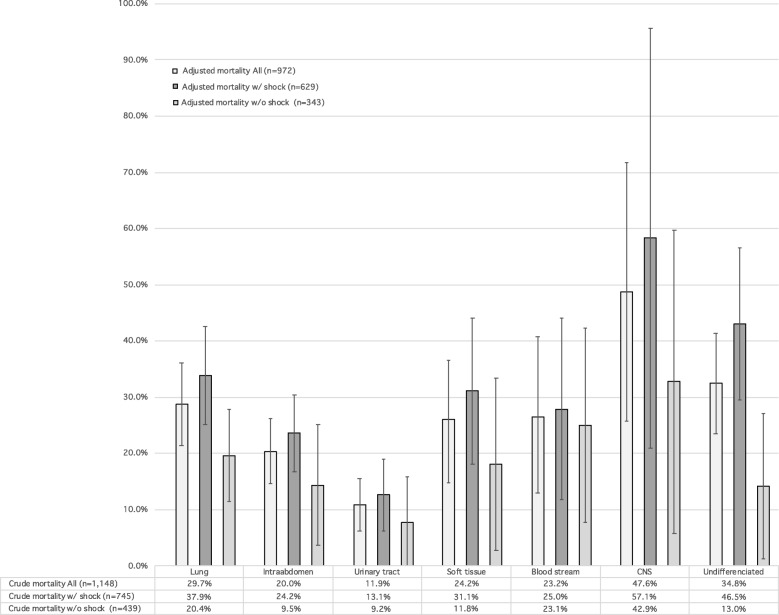
Fig. 1.
Crude and adjusted in-hospital mortality rates for patients with sepsis according to seven major infection sites stratified by shock. The crude mortalities are summarized in the table and adjusted mortalities and its 95% confidence interval calculated by the generalized estimating equation model are demonstrated with a bar graph with error bars.
Data were adjusted for age, sex, Charlson comorbidity index, and organ-specific sepsis-related organ failure assessment (SOFA) scores using marginal standardization. CNS central nervous system

