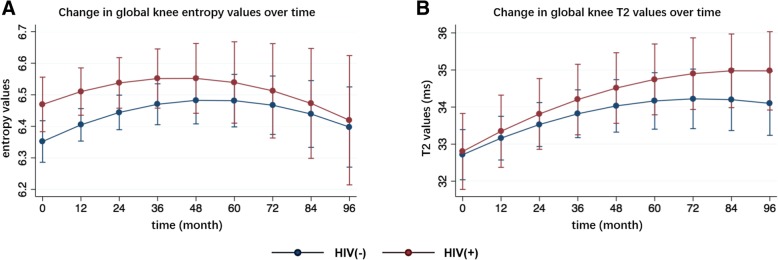
Fig. 1.
Changes in global entropy and global T2 values during the 96-month follow-up. a Changes in global entropy values over 96 months. b Changes in global knee T2 values over 96 months. Data were given as adjusted means, corrected for age, sex, race and baseline BMI and K&L grades. Error bars represented standard errors. P-values in bold refer to significant differences between groups on average over 8 years, respectively: global T2 entropy (P = 0.047), global T2 (P = 0.809)

