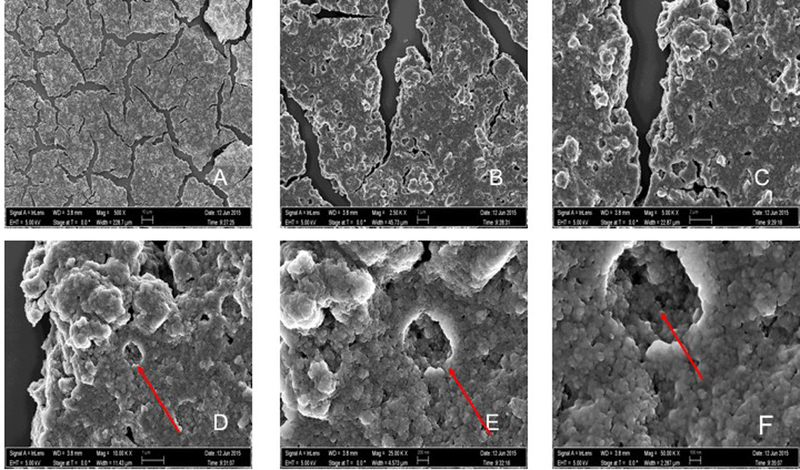
Figure 2.

SEM images demonstrating intense agglomeration of N_TiO2 nanoparticles (40mg/mL, Oak Ridge National Laboratory, USA). Images A-F show magnifications of 500x, 2.50Kx, 5.00Kx, 10.00Kx, 25.00Kx and 50.00Kx, respectively. It is possible to observe on the images of higher magnification (D-F) that the strong agglomeration pattern promoted the formation of layered structures potentially several hundred microns thick (Z direction).
