Fig. 1.
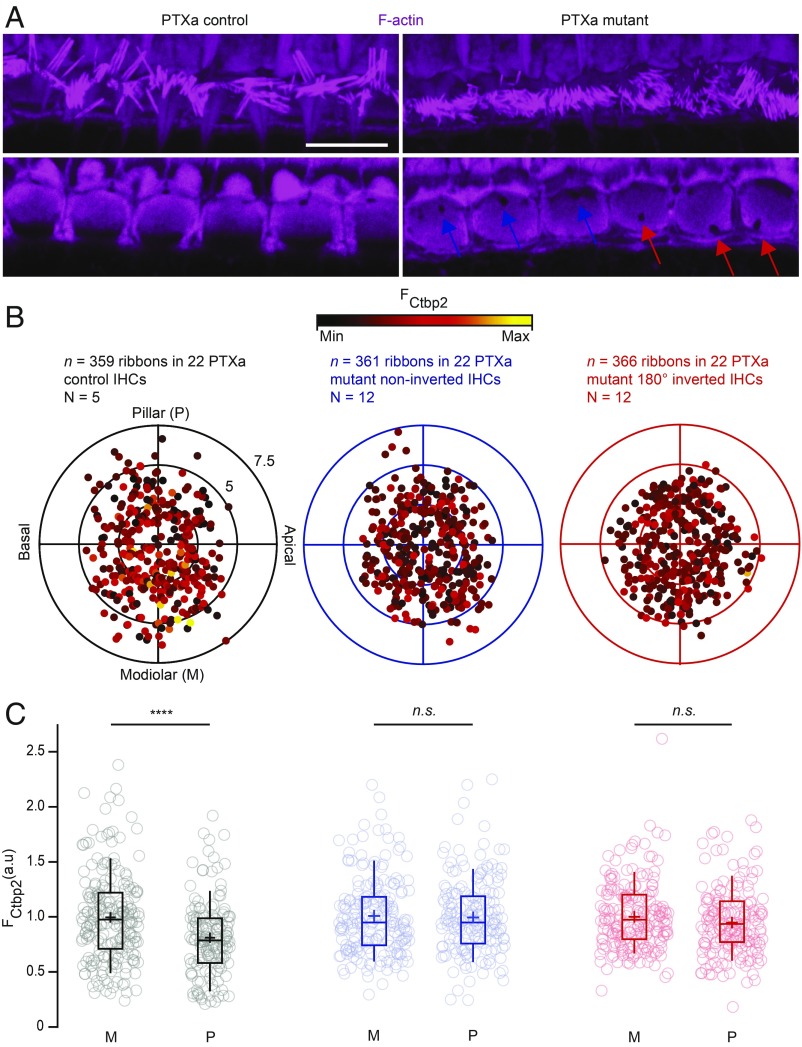
Blocking Gαi signaling by PTXa expression in IHCs disrupts the modiolar–pillar gradient for ribbon size. (A) Maximal projection (Top) and single confocal section (Bottom) of the IHC cuticular plates stained with phalloidin marking F-actin. The immunostainings reveal the shortened and disorganized hair bundles in the PTXa mutant organ of Corti, as well as the misplaced fonticulus/cytoplasmic channel indicating the position of the basal body (blue arrows for PTXa mutant noninverted cells and red arrows for PTXa mutant 180° inverted cells). (Scale bar: 10 µm.) (B) The polar charts (black for PTXa control, blue for PTXa mutant noninverted cells, and red for PTXa mutant 180° inverted cells) display locations and intensities of immunofluorescently labeled CtBP2 marking the ribbons. Modiolar and pillar refer to facing toward or away from the ganglion in the modiolus; apical and basal refer to the tonotopic axis of the organ of Corti. The fluorescence intensity of each CtBP2 signal point is reflected by its color, with warmer, yellow tones indicating higher intensity and cooler, darker tones indicating lower intensity. Each radial circle is 2.5 µm. (C) The IHCs from PTXa control condition display a significant gradient with stronger ribbons in the modiolar side (M) compared with the pillar side (P) [PTXa control (black), modiolar, n = 211 AZs vs. pillar, n = 148 AZs, P < 0.00001, Mann–Whitney–Wilcoxon test]. This gradient collapsed completely in the PTXa mutant IHCs regardless of the fonticulus position [PTXa mutant noninverted (blue), modiolar, n = 190 AZs vs. pillar, n = 171 AZs, P = 0.88; PTXa mutant 180° inverted (red), modiolar, n = 192 AZs vs. pillar, n = 174 AZs, P = 0.75, Mann–Whitney–Wilcoxon test for both conditions]. Box plots show 10th, 25th, 50th, 75th, and 90th percentiles with individual data points overlaid; means are shown as crosses.

