Fig. 3.
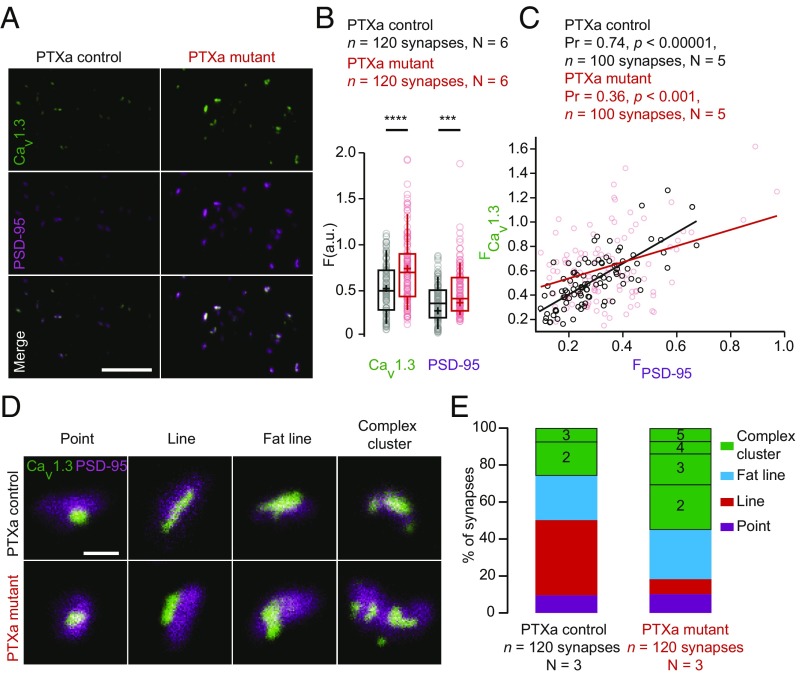
PTXa-expressing IHCs exhibit enlarged CaV1.3 channel and PSD-95 clusters. (A) Maximum intensity projections of confocal sections from organs of Corti immunolabeled for CaV1.3 Ca2+ channels and PSD-95. (Scale bar: 5 µm.) (B) Mean immunofluorescence intensities of synaptic CaV1.3 Ca2+-channel clusters and PSD-95 (estimated by the maximal amplitude of 2D Gaussian fits) were significantly increased in the PTXa mutant IHCs (red circles) compared with PTXa control IHCs (black circles) (n = 120 synapses; N = 6 for both conditions; P < 0.00001 and P = 0.0009 for CaV1.3 and PSD-95 spots, respectively; Mann–Whitney–Wilcoxon test for both conditions). (C) Scatter plot displaying the immunofluorescence intensities of CaV1.3 spots against their associated PSD-95 spots. A positive correlation is found in the PTXa control condition (black circles, Pearson coefficient of 0.74, P < 0.00001, n = 100 synapses, N = 5), while the correlation is much weaker in the PTXa mutant IHCs (red circles, Pearson correlation coefficient of 0.36, P < 0.001, n = 100 synapses, N = 5). (D) Representative examples of AZs immunolabeled against CaV1.3 Ca2+ channels and PSD-95, acquired with 2D-STED microscopy. AZs from both conditions exhibited point-like clusters (defined by a Gaussian fitting ratio L.A./S.A. < 2); some clusters formed lines (defined by an S.A. < 140 nm), fat lines (defined by an S.A. > 140 nm), and complex arrangements (defined by two or more structures). (Scale bar: 500 nm.) (E) The CaV1.3 Ca2+-channel clusters were categorized according to these arrangements. PTXa control and mutant IHCs exhibited similar proportions of point-like clusters (9 and 10%, respectively; violet). Around 40% of the control AZs showed the typical line-like organization of CaV1.3 immunofluorescence; these structures were more sporadic in mutant IHCs (8%; red). However, the fat line clusters (blue) had comparable prevalence in both PTXa control (23%) and mutant (27%) conditions. Strikingly, a difference was found for the proportion of complex clusters that were much more frequent in the PTXa mutant condition (55% against 26% in the PTXa control IHCs). Additionally, these features exhibited up to three structures at the control AZs, while the mutant ones could present up to five (n = 120 synapses, N = 3 for both conditions).

