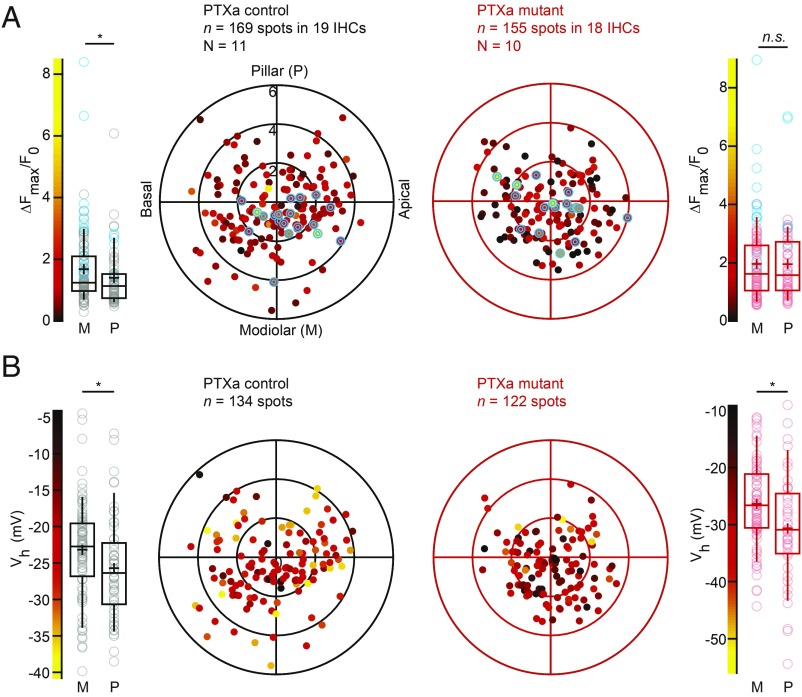
Fig. 6.
The modiolar–pillar gradient for synaptic Ca2+ influx strength is collapsed upon PTXa expression, but the gradient for voltage-dependent activation is preserved. (A) The polar charts display intensities of maximal AZ Ca2+ influx (∆Fmax/F0) as a function of AZ positions in live-imaging experiments. Modiolar and pillar refer to facing toward or away from the ganglion in the modiolus; apical and basal refer to the tonotopic axis of the organ of Corti, as for B. Box plots of the ∆Fmax/F0 and ∆Fmax/F0 estimates of individual IHCs show that the PTXa control conditions exhibit significantly stronger Ca2+ hotspots in the modiolar side compared with the pillar side (PTXa control, modiolar, n = 104 AZs; pillar, n = 65 AZs, P = 0.033, Mann–Whitney–Wilcoxon test), whereas this gradient is completely collapsed in the PTXa mutant (PTXa mutant, modiolar, n = 98 AZs; pillar, n = 57 AZs, P = 0.91, Mann–Whitney–Wilcoxon test). The strongest AZs from each cell are highlighted in blue in both polar charts and box plots. Data were pooled from 19 and 18 IHCs in PTXa control and mutant conditions, respectively; box plots show 10th, 25th, 50th, 75th, and 90th percentiles with individual data points overlaid; each radial circle is 2 µm, and means are shown as crosses, as for B. (B) The polar charts display voltages for half-maximal activation Vh as a function of AZ positions in live-imaging experiments. Box plots of the voltage for half-maximal activation Vh and Vh estimates of individual IHCs show a significant hyperpolarized shift of the fractional activation of the CaV1.3 channels in the pillar side compared with the modiolar side in both control and mutant conditions (PTXa mutant, modiolar, n = 80 AZs; pillar, n = 42 AZs, P = 0.013; PTXa control, modiolar, n = 81 AZs; pillar, n = 53 AZs, P = 0.039; t test for both conditions).

