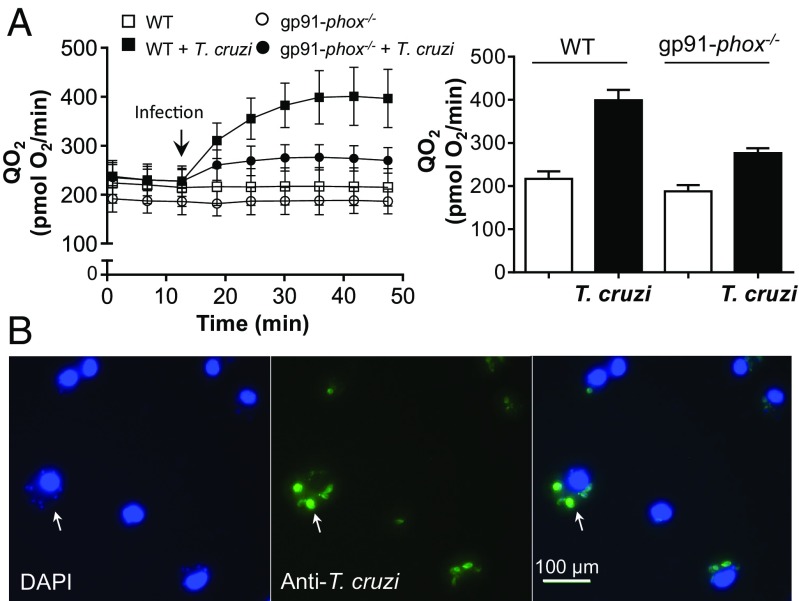
Fig. 7.
Oxygen consumption and phagocytosis after T. cruzi infection. (A) O2 consumption from WT or gp91-phox−/− macrophages were measured (Seahorse) before and after (arrow) T. cruzi-opsonized trypomastigote injection (parasite-to-macrophage ratio of 20:1; anti-T. cruzi antibody) at 37 °C (Left). Data at times 20 to 25 min after injection were plotted (Right) and represent the mean ± SEM of 10 samples. (B) Phagocytosis yield was evaluated by counting the number of phagosomes per cell with DAPI and FITC anti-T cruzi stain. (Magnification: 400×.)

