Fig. 1.
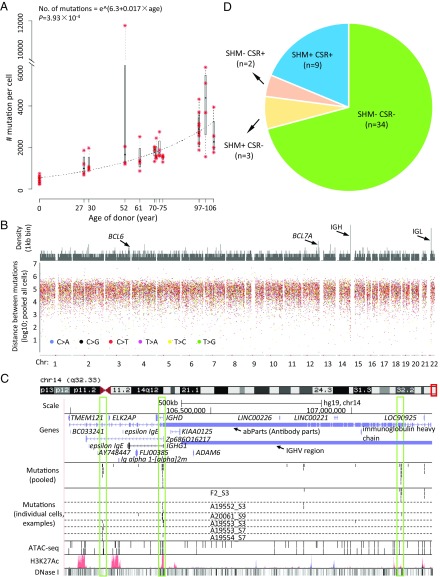
Somatic mutations accumulate with age in human B lymphocytes. (A) The number of somatic mutations per genome as a function of age. Red asterisks indicate individual cells. Each box corresponds to summary statistics of four cells from one donor. Regression was performed on the median numbers of mutations of the four cells from each donor, using exponential model nonlinear least squares regression. (B) Rainfall plot illustrating distances of neighboring mutations. (Top) Density of mutations (56 cells pooled) in kilobase bins. (Bottom) Distances of each mutation to its closest other mutation. (C) Mutation hotspots in Ig H chain regions visualized using the UCSC Genome Browser. In the mutation panels, each bar represents one SNV. In the ATAC sequencing (ATAC-seq) panel, obtained from pooled B cells from one young individual and one old individual, each bar represents one open chromatin peak. Other panels were obtained from annotations of the UCSC Genome Browser. The three vertical boxes highlight three hotspots identified in this region. (D) The SHM and CSR status of the 48 adult B cells; all eight B cells from cord blood are SHM−CSR−. As expected, the majority of adult B cells are classified into two categories: SHM−CSR− (primarily naïve B cells) and SHM+CSR+ (memory B cells). A few cases of SHM+CSR− and SHM−CSR+ cells are known as nonswitched memory B cells and GC-independent memory B cells, respectively.

