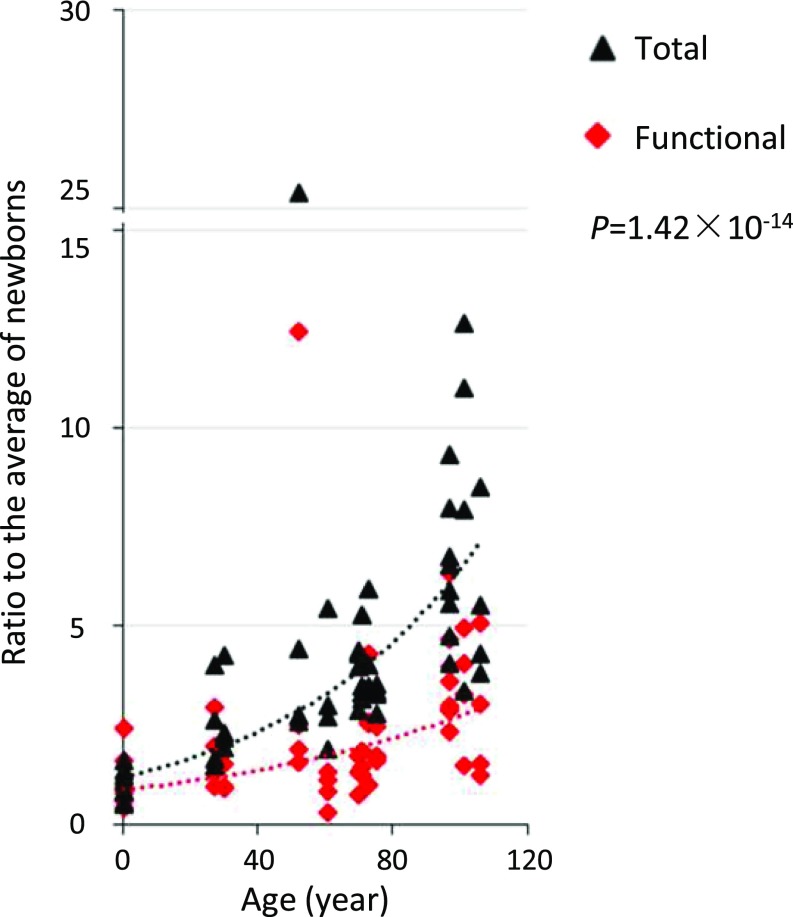
Fig. 3.
Accumulation of mutations in the functional genome and genome overall during aging. Each data point represents the ratio of the number of mutations per cell to the average of the mutation number per cell in newborn B lymphocytes (functional genome and whole genome calculated separately). The ratios of the functional genome are in red, and those in the genome overall are in black. P values are two-tailed and were estimated using the Wilcoxon signed-rank test.

