Fig. 2.
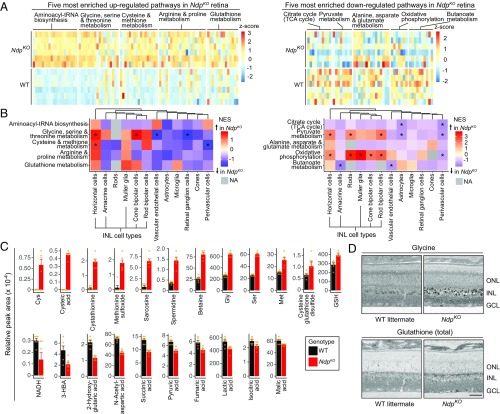
Untargeted metabolic profiling of WT and NdpKO retinas reveals metabolic changes centered around glutathione and one-carbon metabolism. (A) Heat maps showing individual metabolites in the top five up-regulated in NdpKO (Left) and top five down-regulated in NdpKO (Right) metabolic pathways as determined by overrepresentation analysis. Each row represents an independent retina sample, and each column represents a metabolite. (B) Heat maps showing enrichment scores for each cell type in GSEA for the same 10 NdpKO-enriched pathways shown in A. NA, nonapplicable (gray), indicating that GSEA could not be performed due to the low signal for the relevant pathway genes in a particular cell type; NES, normalized enrichment score. *P value of <0.05. (C) Bar plots showing relative MS peak areas for representative metabolites in the NdpKO-enriched metabolic pathways listed in A. Error bars represent the SEM. Orange dots represent individual samples. (D) Immunogold staining with antibodies raised against metabolite-hapten conjugates followed by silver intensification. Elevated levels of glycine and total glutathione in NdpKO retinas were mainly localized to the INL. GCL, ganglion cell layer; ONL, outer nuclear layer. (Scale bar: 50 μm.)

