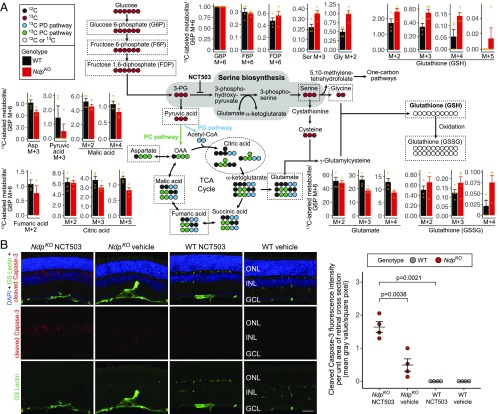
Fig. 3.
Metabolic flux analysis and pharmacological inhibition reveal enhanced de novo serine biosynthesis in NdpKO retinas in vivo. (A) Schematic showing the fates of 13C atoms from uniformly labeled 13C-glucose. For metabolites enclosed in dashed lines in the schematic, the surrounding bar plots show the mean ratios of the measured abundances of 13C-labeled metabolites to the abundance of 13C-glucose 6-phosphate (M + 6) for WT and NdpKO retinas. Orange dots represent individual samples. PC pathway, pyruvate carboxylase pathway; PD pathway, pyruvate dehydrogenase pathway. (B) The effect on apoptotic pathway activation of systemic treatment with NCT503 (an inhibitor of PHGDH; 40 mg/kg vs. vehicle, daily i.p. injections for 12 d). (Left) Representative images of immunofluorescence of retina cross-sections showing blood vessels (GS Lectin; green), cleaved Caspase-3 (red), and nuclei (DAPI; blue). (Right) Quantification of cleaved Capase-3 immunofluorescence of two random whole-retina cross-sections per eye. Horizontal bars represent the mean and the SEM. GCL, ganglion cell layer; ONL, outer nuclear layer.

