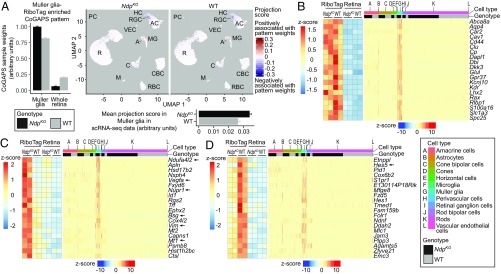
Fig. 4.
RiboTag and scRNA-seq analysis of Muller glia-enriched transcripts in WT and NdpKO retinas converge on a common set of differentially expressed genes. (A, Left) CoGAPS sample weights of the Muller glia-RiboTag–enriched pattern for Muller glia-RiboTag and whole-retina samples. (A, Upper Right) Projections of the Muller glia-RiboTag–enriched pattern into WT and NdpKO scRNA-seq datasets visualized on UMAP plots. (A, Lower Right) Mean projection scores of the Muller glia-RiboTag–enriched pattern in NdpKO and WT Muller glia clusters of the scRNA-seq datasets. Error bars represent the SEM. (B) Expression of Muller glia-enriched transcripts in Muller glia-RiboTag vs. whole-retina RNA-seq (Left) and in scRNA-seq (Right). In B–D, each cell in the scRNA-seq dataset is represented by a point along the horizontal axis, and the regions of the plot corresponding to different cell types and to WT vs. NdpKO are color coded across the top. (C) Analysis as in B, except that C shows Muller glia-enriched transcripts that were also up-regulated in NdpKO retinas in the Muller glia-RiboTag RNA-seq (Left) and scRNA-seq datasets (Right). (D) Analysis as in B, except that D shows Muller glia-enriched transcripts that were also down-regulated in NdpKO retinas in the Muller glia-RiboTag RNA-seq (Left) and scRNA-seq datasets (Right). As seen in B–D, among retinal cells, retinal astrocytes bear the closest resemblance to Muller glia as judged by their patterns of transcript abundances. A, astrocyte; AC, amacrine cell; C, cone; CBC, cone bipolar cell; HC, horizontal cell; M, microglia; MG, Muller glia; PC, perivascular cell; R, rod; RBC, rod bipolar cell; VEC, vascular endothelial cell.

