Fig. 6.
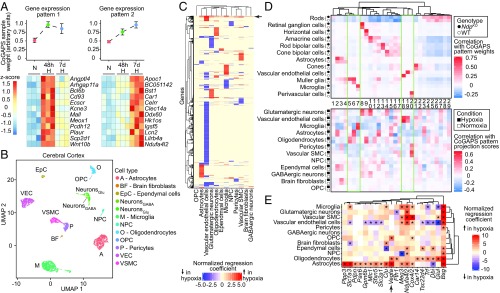
Single-cell RNA-seq reveals correlated transcriptional changes between chronically hypoxic mouse cerebral cortex and NdpKO INL cell types. (A, Upper) Plots showing CoGAPS sample weights of whole-brain RNA-seq from mice exposed to normoxia (N), 48-h hypoxia (48 h H), and 7-d hypoxia (7 d H) for two distinct expression patterns determined by CoGAPS. Error bars represent the SEM. (A, Lower) Heat maps for examples of genes specific to the two CoGAPS patterns, showing gene expression (z score) across triplicate samples for the three experimental conditions listed above the heat maps. Each column represents a sample. (B) UMAP plot of scRNA-seq data from cerebral cortex from mice exposed to normoxia (control) and 7-d hypoxia. NeuronsGABA, GABAergic neurons; NeuronsGlu, glutamatergic neurons; NPC, neural progenitor cells; OPC, oligodendrocyte precursor cells; VEC, vascular endothelial cells; VSMC, vascular smooth muscle cells. (C) Heat map showing normalized regression coefficients for transcripts with statistically significantly differences on scRNA-seq differential gene expression analysis in cortical cell types exposed to 7-d hypoxia vs. normoxia. The arrow points to a cluster of known hypoxia-indicible genes. (D, Upper) Heat map showing correlation of single-cell CoGAPS pattern weights with cell type and genotype in the retina scRNA-seq dataset. (D, Lower) Heat map showing correlation of cortical cell type and condition with projection scores of the retinal patterns above projected into the cortical scRNA-seq dataset. Patterns are numbered sequentially according to their order in the associated dendrogram. Each pattern in the heat map D, Upper is aligned with its corresponding projection in the heat map in D, Lower. (E) Heat map showing, for each cortical cell type, the normalized regression coefficients for transcripts enriched in the Muller glia-associated single-cell CoGAPS patterns that are also up-regulated in astrocytes and/or oligodendrocytes from 7-d hypoxia cerebral cortices. *q value of <0.05.

