Fig. 4.
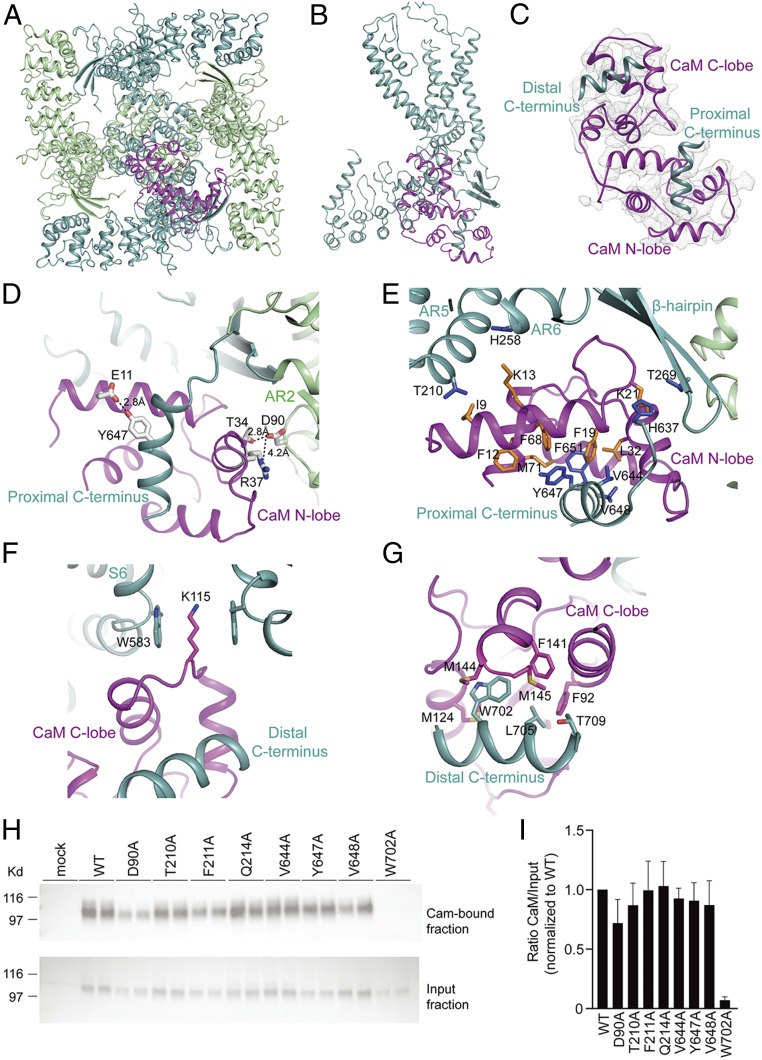
Structure of the TRPV5-CaM complex. (A) Bottom view of TRPV5-CaM with the two subunits including the CaM-interacting one (light teal) and the other two (pale green). CaM is in magenta. (B) Side view of a TRPV5 monomer (light teal) with CaM (magenta) interaction at the C terminus. (C) Overview of CaM (magenta) interacting with two C-terminal helices of TRPV5 (light teal). (D–H) Close-up views of the CaM N-lobe (D and E) and CaM C-lobe (F and G) interacting with the TRPV5 N and C termini. Side chains of hydrophobic interactions are shown as sticks for both CaM (orange) and TRPV5 (blue). In D, interatomic distances between side chains are depicted. (H) CaM-binding assay of HEK293 cells transfected with WT TRPV5 and the indicated mutants. Samples were analyzed by immunoblotting with GFP antibody. The CaM fraction represents the TRPV5 bound to the CaM agarose beads (Top), and input demonstrates TRPV5 expression in total cell lysates (Bottom). A representative immunoblot of three independent experiments is shown. (I) Quantification of the immunoblots is depicted as percentage of WT, which represents the relative CaM binding compared with input.

