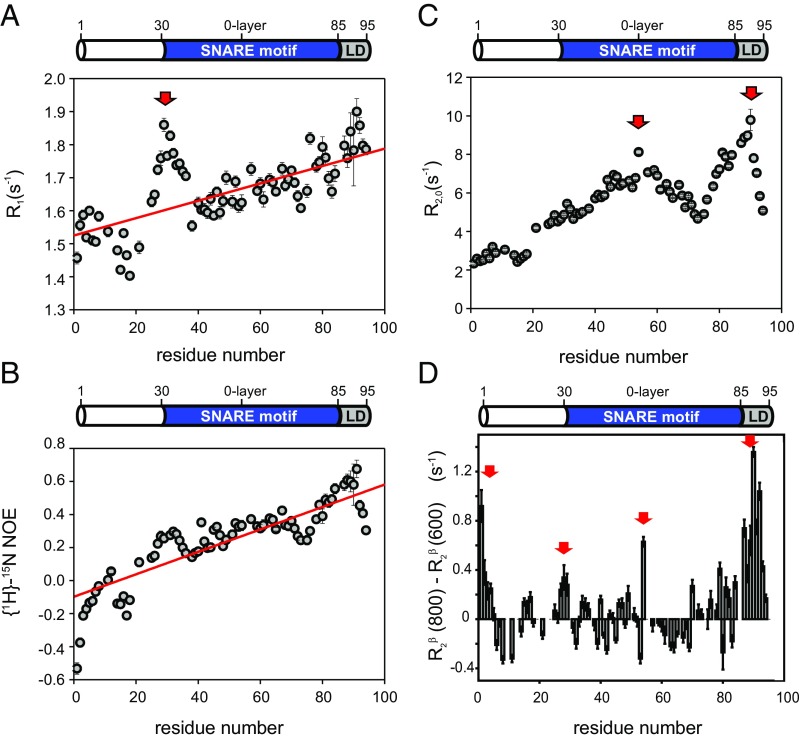
Fig. 2.
Backbone dynamics of syb-2. The 15N relaxation data recorded for syb-2 (1–96) are shown. (A) 15N R1 relaxation rate constants recorded at 600 MHz versus residue. The red arrow highlights the unusually high values of 15N R1. The red line corresponds to the linear fit indicating the increase of rigidity of the protein backbone versus residue. (B) {1H}-15N NOE values versus residue increase linearly from the N terminus to the C terminus. The red line corresponds to the linear fitting indicating the increase of rigidity of the protein backbone versus residue. (C) 15N R2,0 relaxation rate constants recorded at 600 MHz (derived from 15N R1ρ with a 2-kHz RF field; R1 contribution-corrected) plotted versus residue. Red arrows highlight the two maxima in the dataset. (D) Hahn-echo transverse relaxation rates, R2β, at 800 MHz minus those measured at 600 MHz. Positive values indicate Rex contributions due to conformational dynamics on a microsecond-millisecond time scale. Regions subject to such conformational exchange processes are highlighted by red arrows.

