Fig. 5.
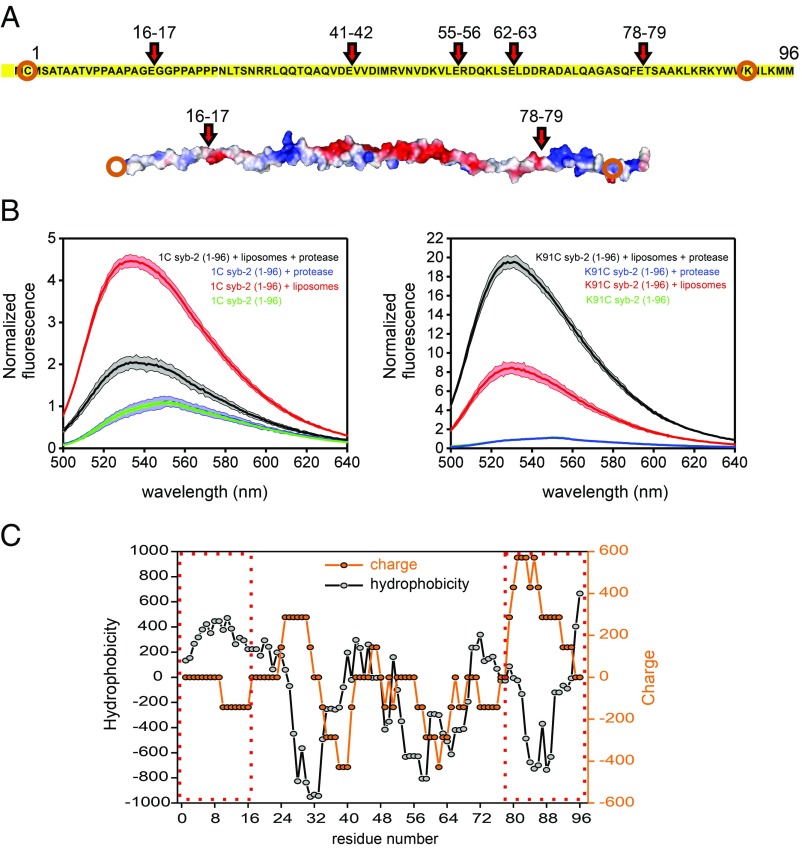
Cooperative lipid binding of syb-2. Lipid binding of labeled syb-2 fragments after cleavage of syb-2 (1–96) with endoproteinase Glu-C. (A) Predicted cleavage sites (showing the residue numbers) of endoproteinase Glu-C from Staphylococcus aureus V8 in syb-2 (1–96) and electrostatic potential (determined using PyMOL, modified from Protein Data Bank ID code 2KOG). Orange circles indicate the labeled residue in each fragment. (B) Fluorescence spectra of NBD-labeled cysteine mutants 1C and K91C were recorded before and after digestion by endoproteinase Glu-C. Green traces show spectra acquired in the absence of liposomes, red traces show spectra acquired in the presence of liposomes before digestion, and blue and black traces show spectra acquired after digestion in the presence of liposomes (black) or without (blue). The colored area represents the SD for n = 3. (C) Hydrophobicity (ExPASy, ProtScale, Eisenberg et al., https://web.expasy.org/protscale/) and charge (EMBOSS, charge, www.bioinformatics.nl/cgi-bin/emboss/charge) scores of syb-2 (1–96). A seven-residue window is used for both calculations. Dashed red boxes indicate the N-terminal and C-terminal fragments, respectively.

