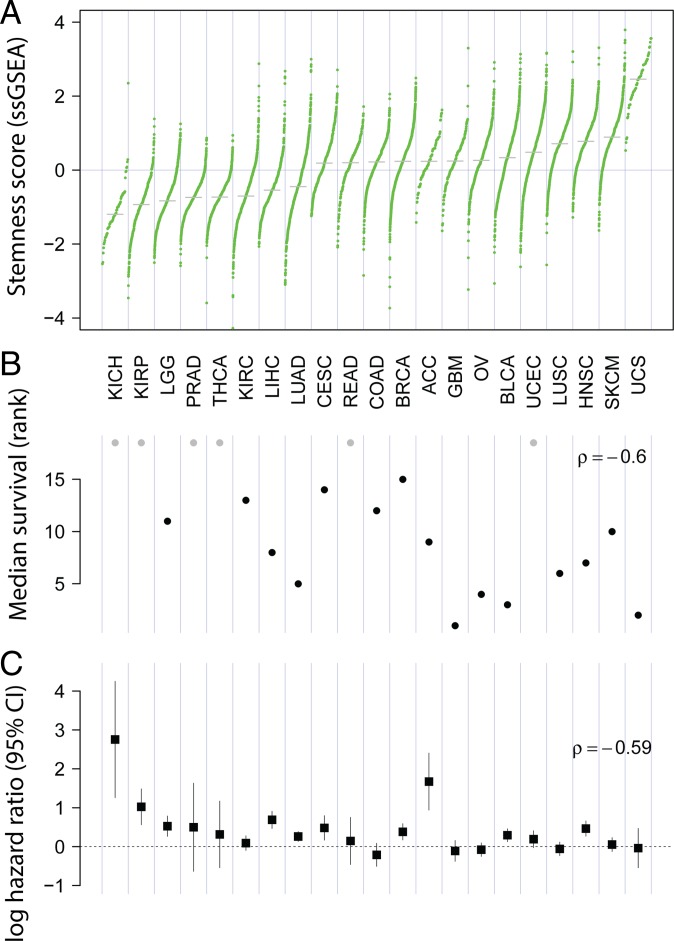
Fig. 1.
Stemness and survival across cancers. (A) Stemness score varies widely across 21 solid cancers from TCGA. Each point represents an individual case, and cancer types are ordered by median stemness score (z-scored ssGSEA). (B) Median survival decreases with increasing median stemness (P = 0.004). Gray points represent cancers in which median overall survival times were not evaluable. (C) Stemness associates with poor outcome within cancers. Log hazard ratio (±95% CI) for the association of stemness with overall survival is shown. Hazard decreases with increasing average stemness of cancers (P = 0.008). Cox models control for patient age and tumor purity. Cancer acronyms are used as defined by TCGA (https://portal.gdc.cancer.gov).

